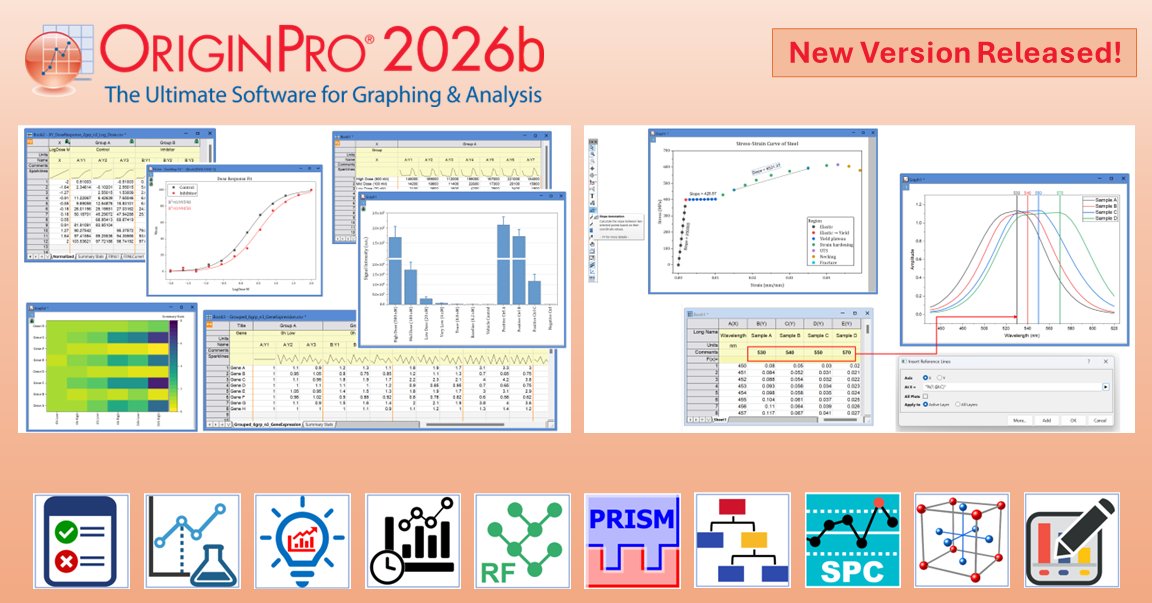
Origin and OriginPro 2026b now available! New features include Life Science Mode, Mirror Columns, Add Columns to other sheets, Graph Annotation Improvements, Statistics and Quality Control Improvements.
Learn more and download a free trial at https://t.co/3KrlYtj3IG
#originpro2026b #originpro #originlab #dataanalysis #datavisualization #scientificgrappling #lifesceicense #QualityImprovement #statistics
Y indexing 1, 2, 3, ... show in column header when there are a lot of Y datasets. https://t.co/rxarsKDdIH
This will help user locate the Nth Y dataset quickly.
Learn more and download a free trial at https://t.co/3KrlYtivT8
#originpro2026b#OriginPro#DataAnalysis #DataVisualization #datamanagement #statistics #scientificgraphing #datavisualization
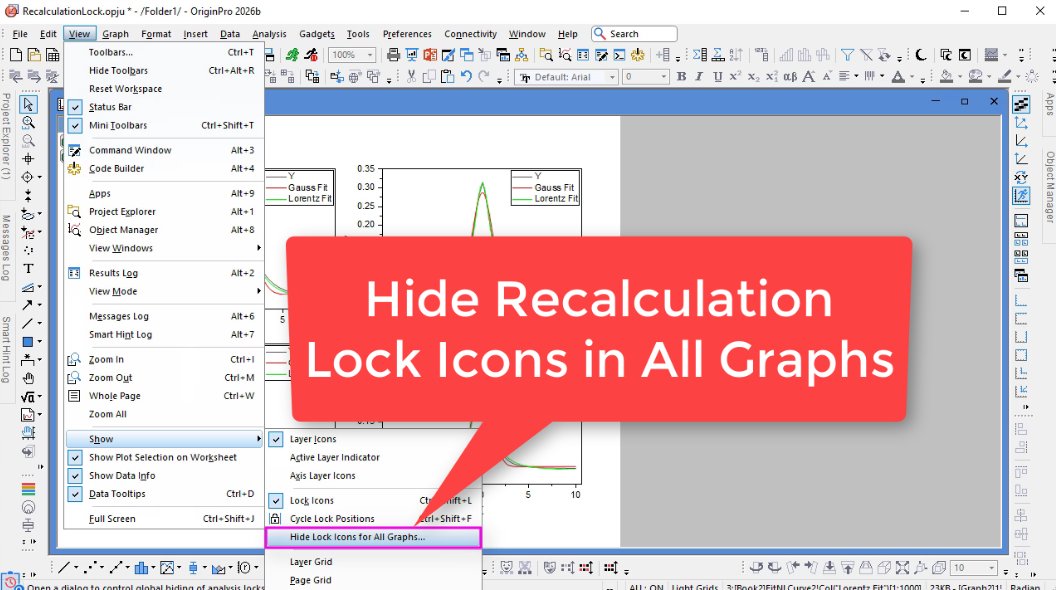
Too many lock icons cluttering your graphs? In Origin 2026b, each analysis operation displays only one lock icon, reducing the chance of icons overlapping with plots.
Want to hide them completely? Watch this video https://t.co/9DkkZGBvzd
Learn more and download a free trial at https://t.co/3KrlYtivT8
#originpro2026b #originlab #originpro #scientificgraphing #datavisualization #dataanalys #statistics
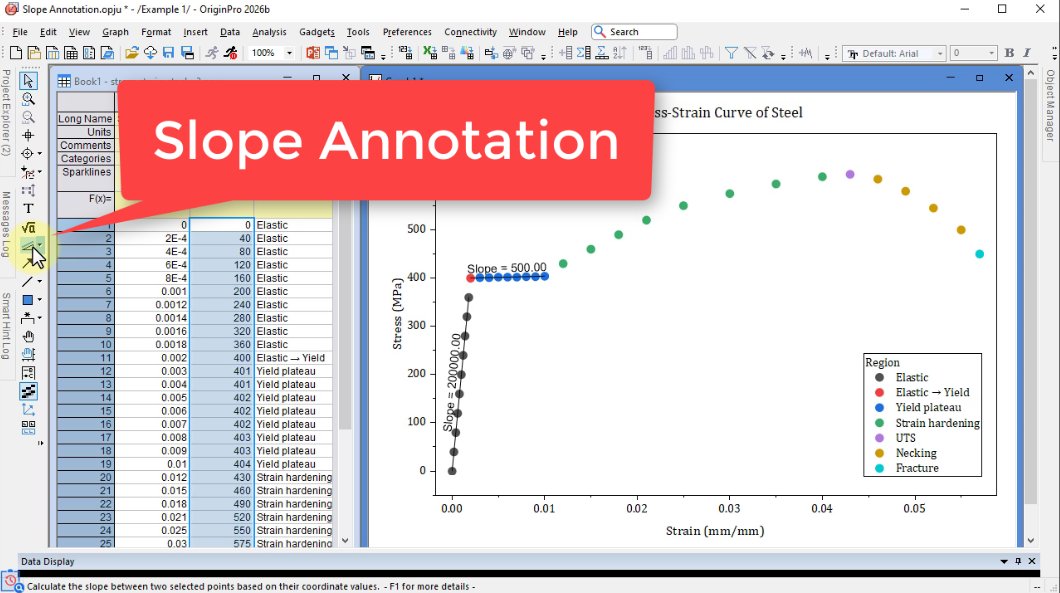
Easily display slope values on your graphs with Origin 2026b!
The new Slope Annotation tool lets you draw a straight line directly on a graph and automatically display its slope.
Watch the video: https://t.co/BCsGuQsHl4
Learn more and download a free trial:
https://t.co/3KrlYtivT8
#OriginPro2026b #OriginLab #OriginPro #ScientificGraphing #DataVisualization #DataAnalysis #Statistics
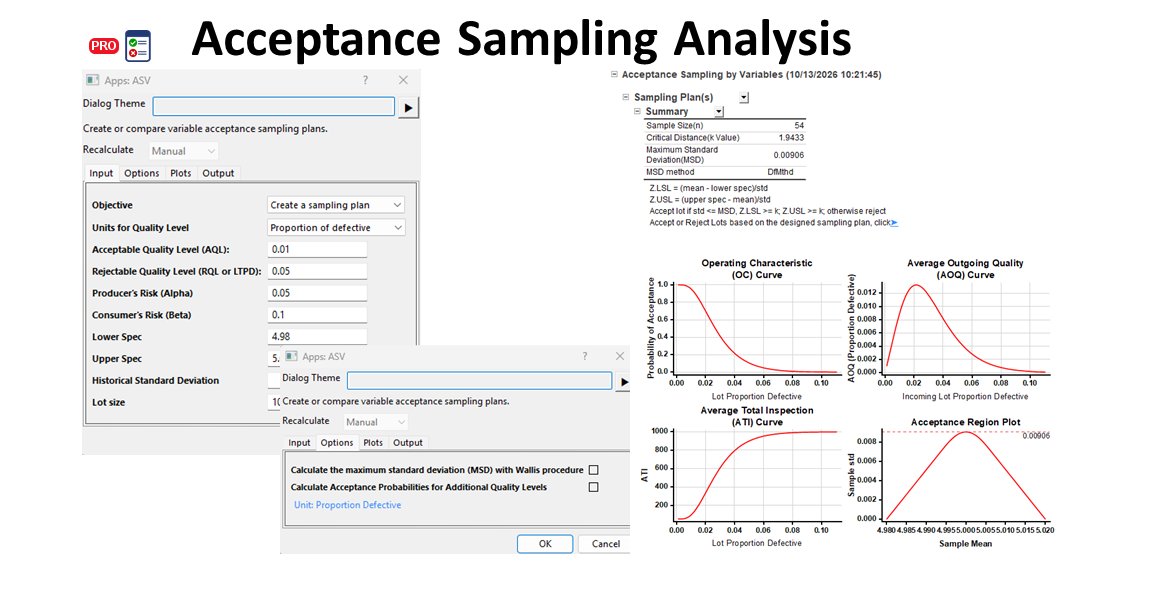
Use OriginPro 2026b’s Acceptance Sampling Analysis app https://t.co/fTk06yJ7qt decide whether to accept or reject an incoming material lot based on information obtained from a representative sample.
Learn more and download a free trial at https://t.co/3KrlYtivT8
#AcceptanceSampling #QualityControl #StatisticalQualityControl #QualityEngineering #DataAnalysis #OriginPro #OriginPro2026b
Origin 2026b lets you rescale or set auto rescale of embedded graphs directly in a worksheet—no need to double-click and open a separate graph window. https://t.co/gdBur6lJ6A Enjoy a smoother, faster workflow!
Learn more and download a free trial at
https://t.co/3KrlYtivT8
#originpro2026b #originlab #originpro #scientificgraphing #datavisualization #dataanalys #statistics
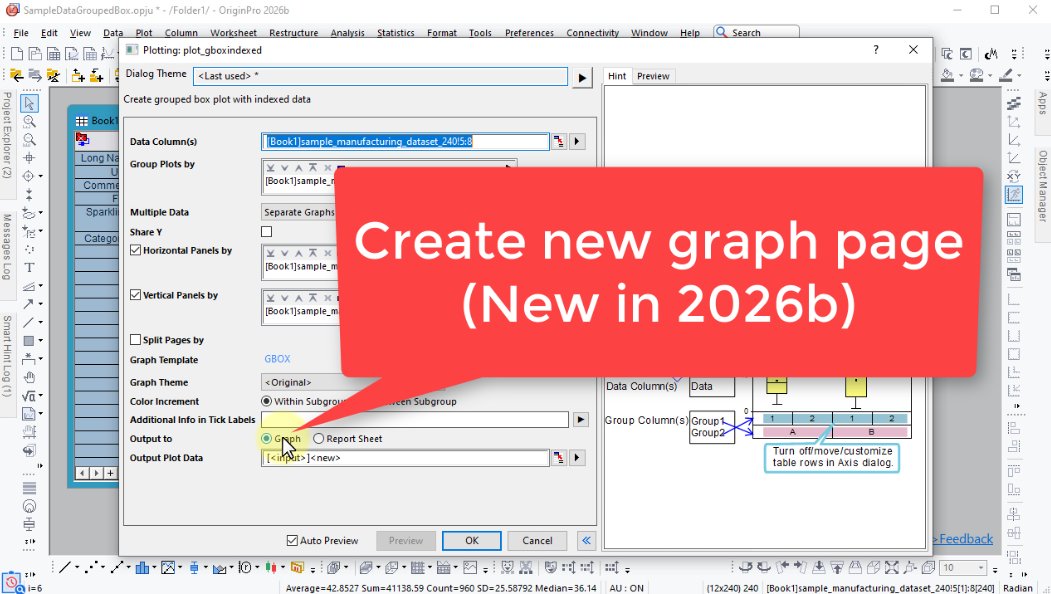
Watch this video https://t.co/krPlkp98Xq. Create statistical graphs in an independent graph window, so you can customize and export them right away—instead of embedding them in the workbook.
Learn more and download a free trial at
https://t.co/3KrlYtivT8
#originpro2026b #originlab #originpro #scientificgraphing #datavisualization #dataanalys #statistics
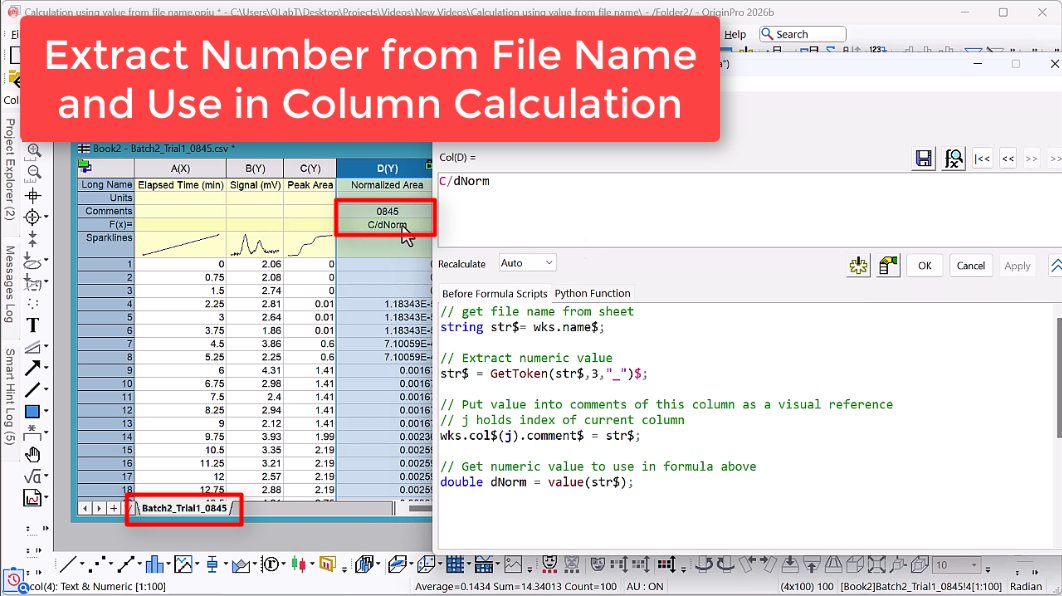
Learn how to extract numeric values from filenames, use them in column calculations, and batch-process multiple files—all in one workflow! https://t.co/BPdxUYIQuJ
Learn more and download a free trial at
https://t.co/3KrlYtivT8
#originpro2026b#originlab#originpro #scientificgraphing #datavisualization #dataanalys #dataimport #datacalculation #DataTransformation
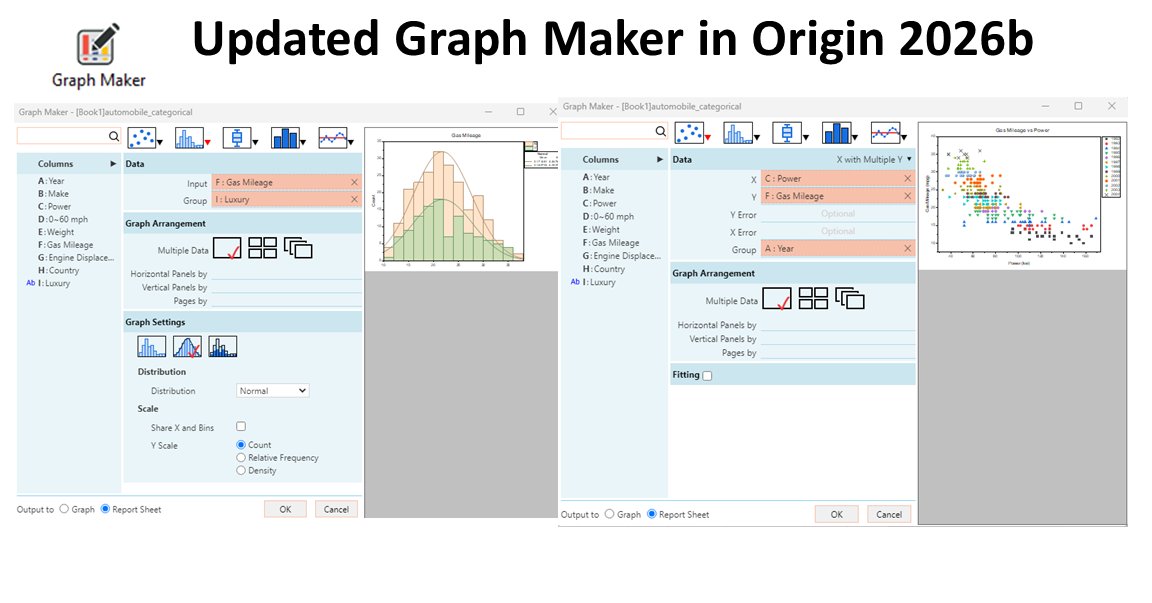
Use OriginPro2026b’s updated Graph Maker (Plot: Graph Maker) to easily create plots. Simply drag and drop Columns to the relevant Data fields. Preview will auto populate on the right.
Learn more and download a free trial at https://t.co/3KrlYtivT8
#DataVisualization#Graphing #DataAnalysis #ScientificGraphing #DataScience #OriginPro #OriginPro2026b
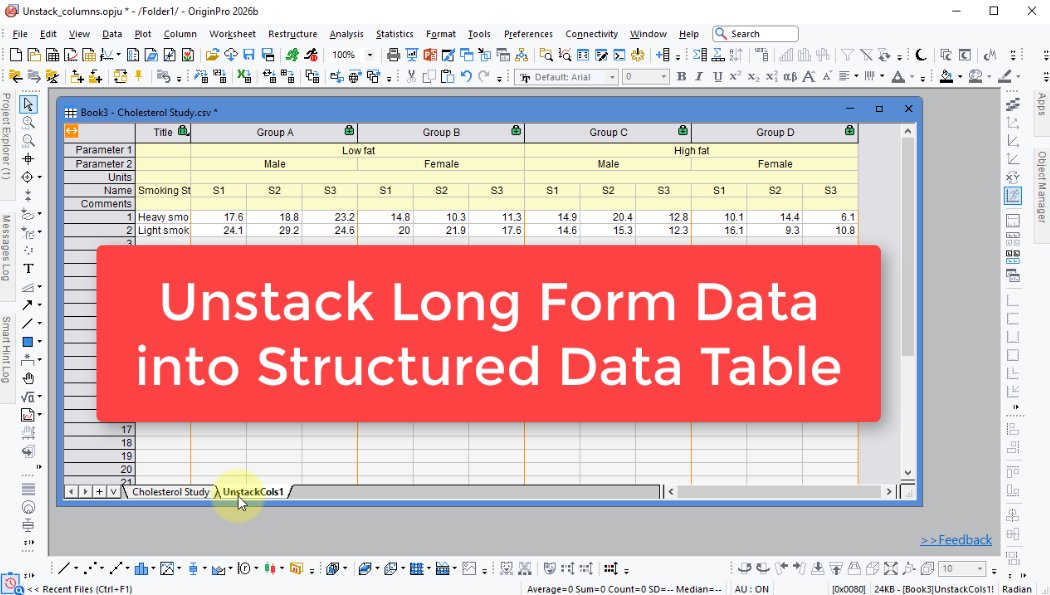
Unstack long form data into structured data table, https://t.co/a8Zg3TQuFD, which is introduced in Origin2026b to streamline plotting and analysis of structured data. After unstacking, the data is more Prism user friendly.
Learn more and download a free trial at https://t.co/3KrlYtivT8
#originpro2026b #originlab #originpro #scientificgraphing #datavisualization #dataanalys #statistics #doseresponse #StructuredData #lifesceicense
Analyze arbitrary-censored time-to-event data with OriginPro2026b’s updated Reliability and Survival Analysis app. https://t.co/SMGuZe15aB.
7 distributions are supported: Normal, Lognormal, Smallest Extreme Value, Weibull, Exponential, Logistic, and Loglogistic, with parameter estimation via Maximum Likelihood or Least Squares.
#ArbitraryCensoring #CensoredData #SurvivalAnalysis #ReliabilityEngineering #LifetimeDataAnalysis #OriginPro #OriginPro2026b
Watch this video https://t.co/yMlnwGLKu1 how to add or insert column(s) from one worksheet to other sheets
Add column to worksheets with similar data structure, or to any worksheet
Add to worksheets in current book, folder or project
If column formula is used, the formula will be copied and applied to other sheets
Learn more and download a free trial at https://t.co/3KrlYtj3IG
#originpro2026b #originlab #originpro #scientificgraphing #datavisualization #dataanalysis #datahandling
New and more powerful version of Design of Experiments app in Origin 2026b: two new analysis tools — Analyze Binary Response and Analyze Variability — as well as a new Select Optimal Design tool for selecting, augmenting, and evaluating experimental design runs. Additionally, the Overlaid Contour Plot tool helps users identify regions in the predictor space where one or more predicted responses meet the desired specifications.
https://t.co/sZsO6nVZ7J
Learn more and download a free trial at
https://t.co/3KrlYtj3IG
#DesignOfExperiments #doe #statistics #scientificgraphing #originpro #originpro2026b #originlab #datavisualization
This video https://t.co/MBpTHwnp1D demonstrates how to bring in data from GraphPad Prism into OriginPro2026b for further analysis and graph.
Origin will automatically detect the structure of the data and put it to the right data table.
Learn more and download a free trial at https://t.co/3KrlYtj3IG
#originpro2026b #originlab #originpro #scientificgraphing #datavisualization #dataanalys #statistics #doseresponse #StructuredData #lifesceicense