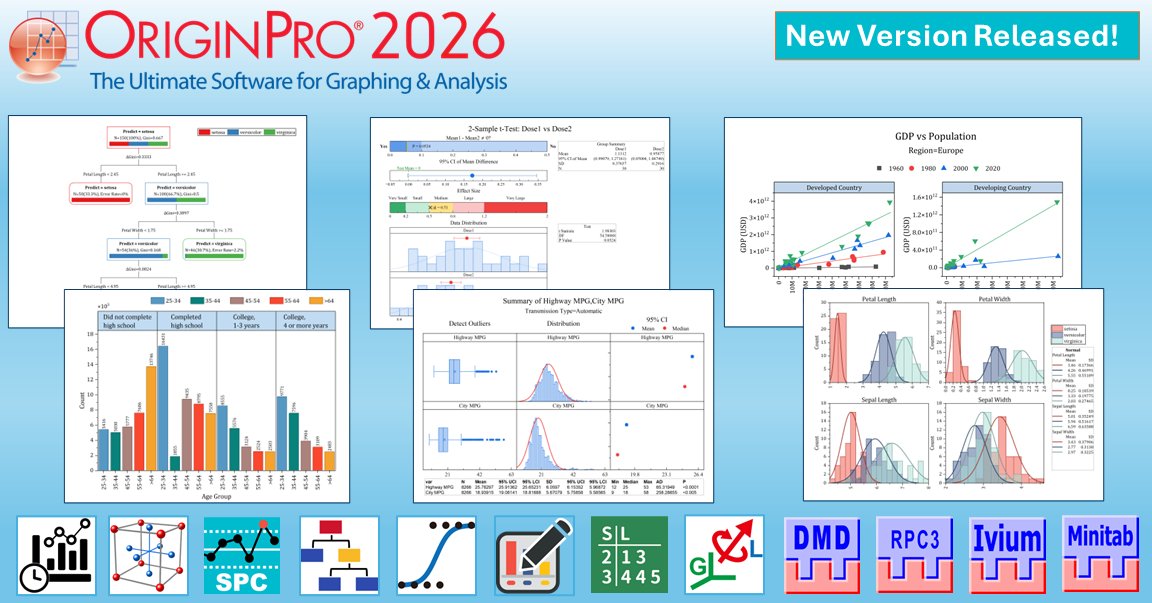
Origin and OriginPro 2026 now available! New features include Flash Fill and Smart Formula, Find in Project Files, Bring in Cell Formula from Excel into Origin, Periodic Refresh for Data Import, Repeat Last Action and Duplicate Operation, New Graph Maker, Graphical Summary for Descriptive Statistics.
Learn more and download a free trial at https://t.co/2OCNTIaiKI
Related video:
https://t.co/VxevHNLdiB
#scientificgraphing #statistics #OriginPro #Originpro2026 #originlab #DataAnalysis #DataVisualization
3rd parameter in LOOKUP function can be skipped in Origin 2026 to return row index, so you can use it to do many tasks without need to try many different functions such as index, list, table, match, search, etc. https://t.co/kd8RcHGN6h
E.g.
* find a string/number in a column and return row index or corresponding value in another column.
* When finding number, the column doesn't need to be monotonic
* When finding number, use 4th parameter to specify finding nearest value, nearest value smaller than or larger than the number.
Learn more and download a free trial at https://t.co/2OCNTIaiKI
#originpro #originpro2026 #originlab #DataAnalysis #DataVisualization #formula #lookup
Interaction plots https://t.co/sP2ptK0JKJ visualize how multiple factors influence a response variable, displaying means for all factor combinations in a matrix of panels. Please select at least 2 factor columns in the dialog.
Learn more and download a free trial at https://t.co/2OCNTIaQAg
#originpro2026 #originpro #originlab #interactionplot #DataAnalysis #DataVisualization #statistics
Create the Main Effects plot in OriginPro 2026 https://t.co/rnDJHjVCch to compare the changes in the level means and decide which categorical variable influences the response the most.
Learn more and download a free trial at https://t.co/2OCNTIaiKI
#originpro#originpro2026 #originlab #DataAnalysis #DataVisualization #statistics #categoricaldata #maineffectsplot
Try our Cyclic Voltammetry app for multi-peak fitting and integration of cyclic data https://t.co/IgvL87VykI
Manually set forward and backward region of interest, peak locations, process one Scan at a time or all.
Learn more and download a free trial at https://t.co/2OCNTIaQAg
#originpro #originpro2026 #DataAnalysis #DataVisualization #CyclicVoltammetry #Electrochemistry #Electrocatalysis
Variability chart visualizes the relationship between factors and a dependent variable https://t.co/iZXBmuFyYO. It can graphically display and connect the mean values at each factor level combination. In Origin 2026, the graph is put in same book as source data sheet for eas#qualitycontrol
Learn more and download a free trial at https://t.co/2OCNTIaQAg
#originpro #originpro2026 #DataAnalysis #DataVisualization #statistics #variabilitychart #qualitycontrol
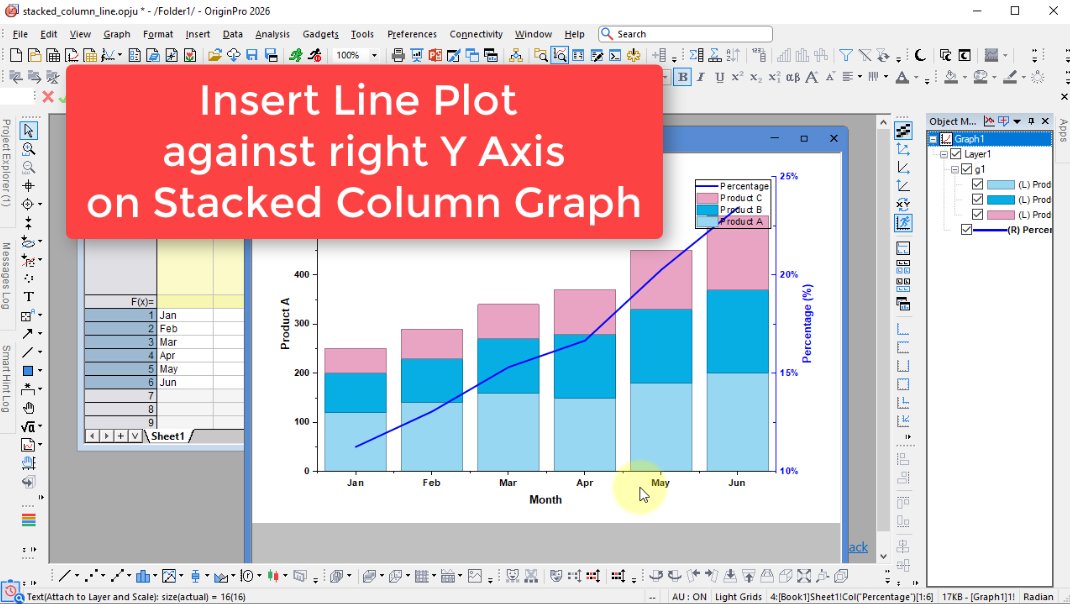
New interactive way to insert a different plot type into an existing graph https://t.co/sAcRp3yJzi and plot against right Y axis to get a Double Y graph.
A common example is adding line plot to a stacked column plot. And set it to plot against right Y axis to create a double Y graph.
Learn more and download a free trial at https://t.co/2OCNTIaiKI
#originpro2026 #originpro #originlab #DataAnalysis #DataVisualization #scientificgraphing #doubley #stackedcolumns #stackedbars
Statistical Methods for Quality Control have been greatly improved over the past versions https://t.co/uQktmG9PTw. Visit our webpage for details
https://t.co/J1G1tZoTIM
Learn more and download a free trial at https://t.co/2OCNTIaQAg
#originpro2026#OriginPro#originlab #DataAnalysis #DataVisualization #scientificgraphing #qualitycontrol #qualityimprovements #SPC #DOE #MSA
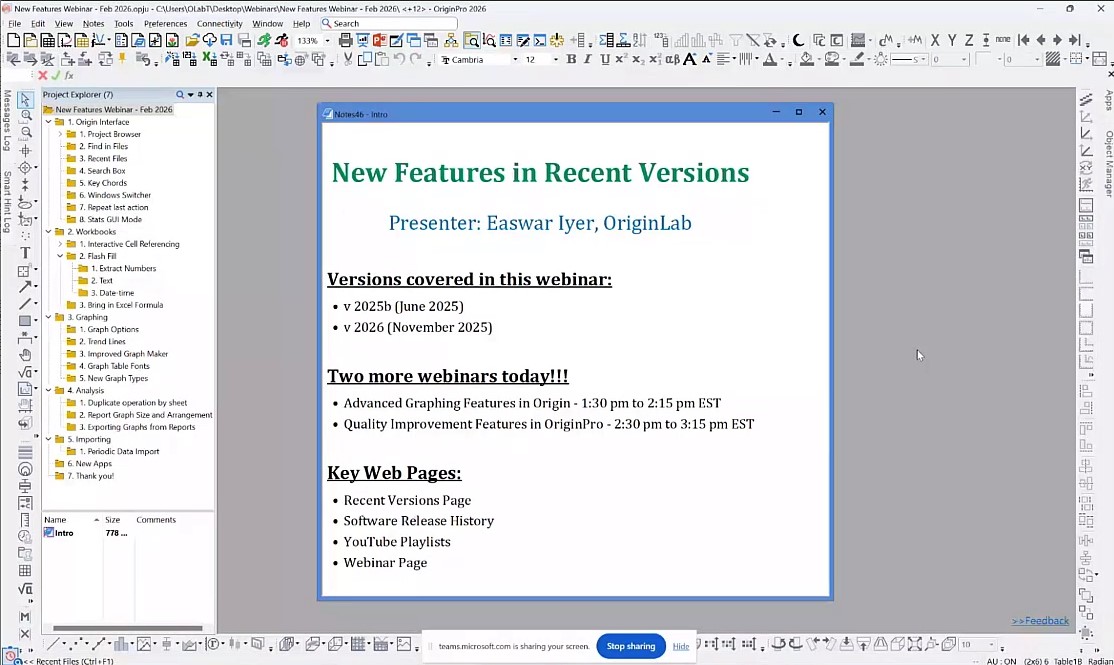
Catch up with some key features in recent versions of OriginPro in this public webinar https://t.co/p9D9oWJHeC, such as Project Browser, Search box, Repeat last action, interactive cell reference in Formula, Flash fill, Graph Maker, etc.
Learn more and download a free trial at https://t.co/2OCNTIaiKI
#originpro2026 #OriginPro #originlab #DataAnalysis #DataVisualization #scientificgraphing
Use the newly added Convert formula to value button https://t.co/cqoUKRCszd if you don't want to share cell formula with others or speed is a concern for huge amount of cell formula.
Learn more and download a free trial at https://t.co/2OCNTIaiKI
#datacalculation#dataprocessing #originpro2026 #OriginPro #DataAnalysis #DataVisualization #scientificgraphing #originlab #cellformula
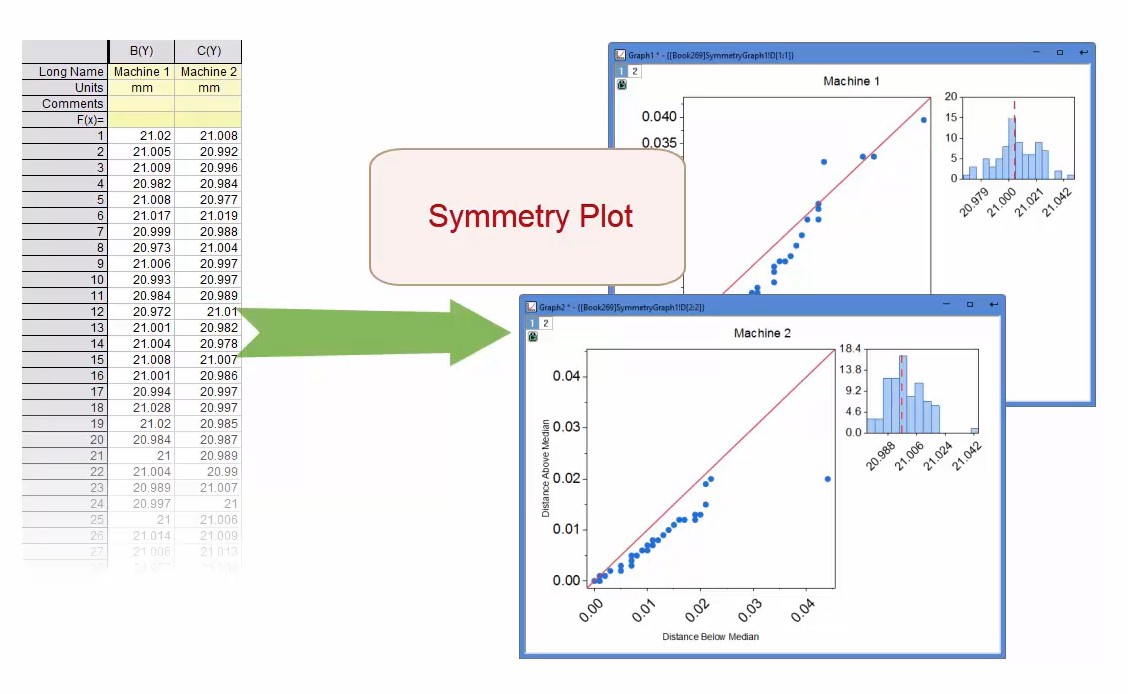
This video demonstrate how to plot multiple data as symmetry plots https://t.co/banoJbc69z and arrange them in Origin 2026.
2026. Learn more and download a free trial at https://t.co/2OCNTIaiKI
#originpro2026#OriginPro#originlab#DataAnalysis#DataVisualization #scientificgraphing #symmetryplot
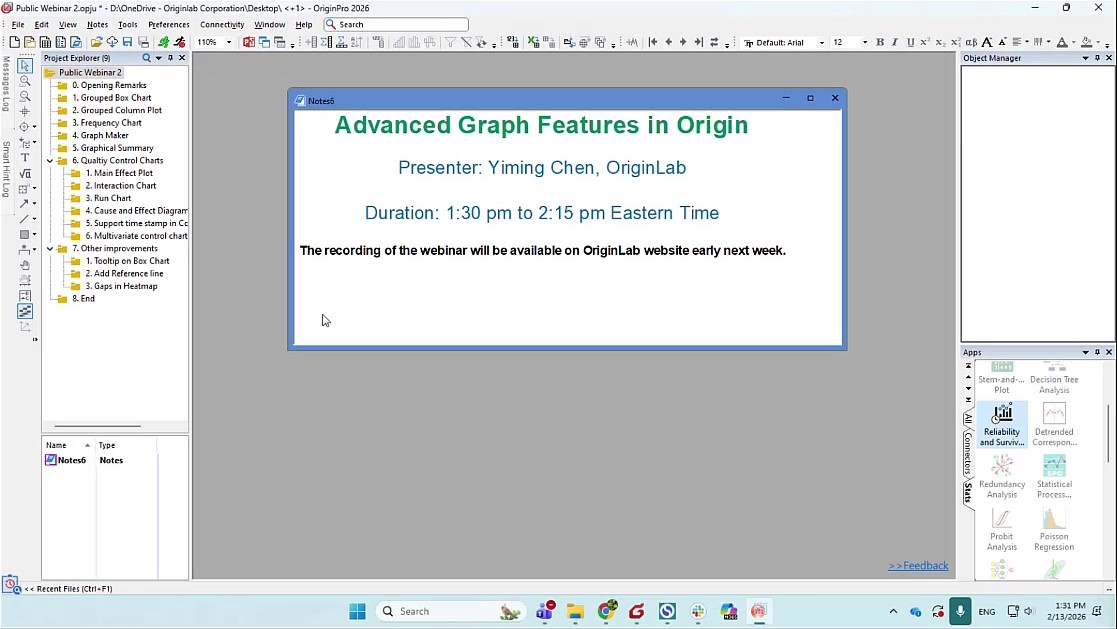
We hosted an Advanced Graphing Features in Origin webinar https://t.co/dLL3AZRD5v based on Origin 2026 recently.
You can download the project file in webinar from https://t.co/THyij1TBKZ
2026. Learn more and download a free trial at https://t.co/2OCNTIaiKI
#originpro #originpro2026 #originlab #DataAnalysis #DataVisualization
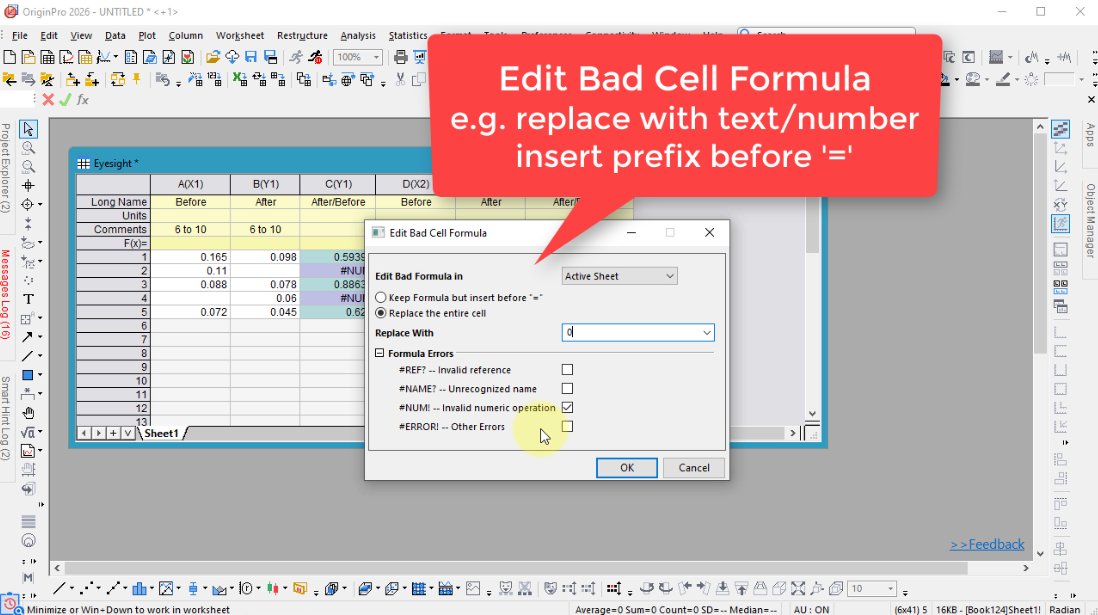
An Edit Bad Formula dialog is added in Origin 2026 https://t.co/P46kBRzwqN to help you handle specific type of bad cell formula.
Learn more and download a free trial at https://t.co/2OCNTIaQAg
#datacalculation#dataprocessing#originpro2026#OriginPro#DataAnalysis #DataVisualization #scientificgraphing #originlab #cellformula
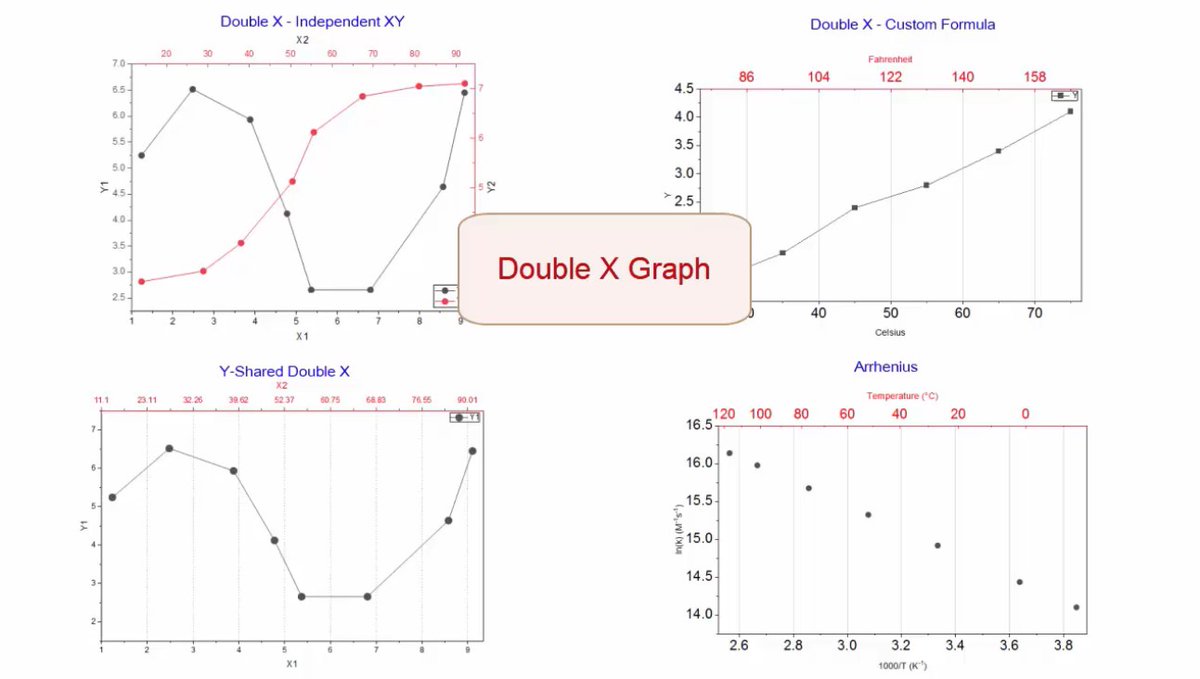
4 types of Double-X plot are added under Plot menu https://t.co/jUQaSbJlCw in Origin 2026 for different needs: Independent XYXY, XY with custom formula for topX, one Y data with two X, and Arrhenious. No need to drag data and customize axis anymore.
Learn more and download a free trial at https://t.co/2OCNTIaiKI
#OriginPro #originpro2026 #originlab #DataAnalysis #DataVisualization #scientificgraphing #DoubleX #doubley #arrhenious
New Decision tree regression in Origin 2026 is a non-parametric supervised learning method used to predict a continuous response variable by recursively partitioning the input space into smaller regions. Each split is chosen to reduce prediction error, and each terminal node (leaf) produces a numeric prediction
https://t.co/57GjZJ5BFz
Learn more and download a free trial at https://t.co/2OCNTIaQAg
#originpro2026 #originpro #DataAnalysis #DataVisualization #scientificgraphing #originlab #regression #machinelearning #decisiontree
Origin 2026 supports import excel file with formula kept https://t.co/hFIa7aSPaw
This is useful for multi-sheet excel files since you don't need to manually copy formulas from each sheet and paste (keep excel formula). Excel imported by Data connector is connected with the Excel files and not allow modification by default. You can click the data connector icon on upper-left corner of worksheet and choose Remove Data Connection first and then edit.
Learn more and download a free trial at https://t.co/2OCNTIaiKI
#originpro2026 #originpro #DataAnalysis #DataVisualization #scientificgraphing #originlab #excel
Symmetry plot was introduced in recent Origin versionshttps://youtu.be/Edsn_Rb4ocg
Multiple data can be plotted together for easier comparison.
Learn more and download a free trial at https://t.co/2OCNTIaiKI
#originpro2026#OriginPro#originlab#DataAnalysis#DataVisualization #scientificgraph #symmetryplot #statistics
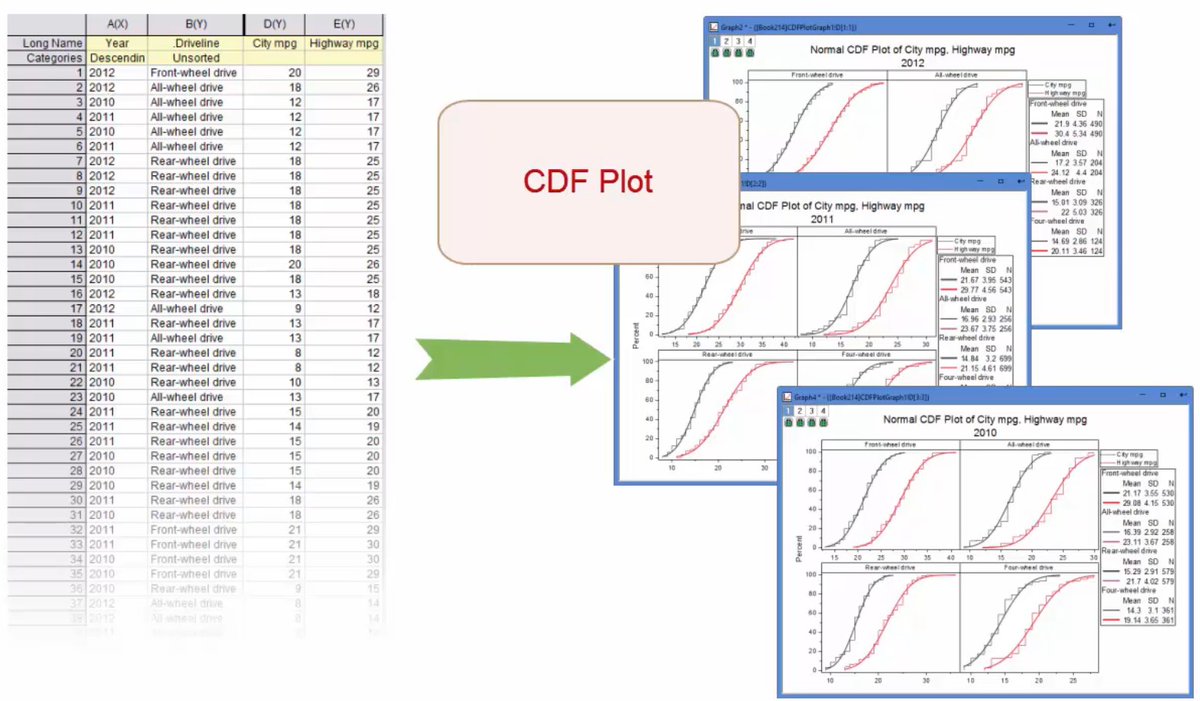
Cumulative Distribution FunctionOrigin 2026 https://t.co/9Rof0Lfdrv provides grouped Cumulative Distribution Function plot (CDF) Empirical, Theoretical or both can be plotted and arranged as separate graphs or as one graph with multiple panels.
Learn more and download a free trial at https://t.co/2OCNTIaiKI
#originpro2026 #OriginPro #originlab #DataAnalysis #DataVisualization #scientificgraphing #cdf #categoricaldata