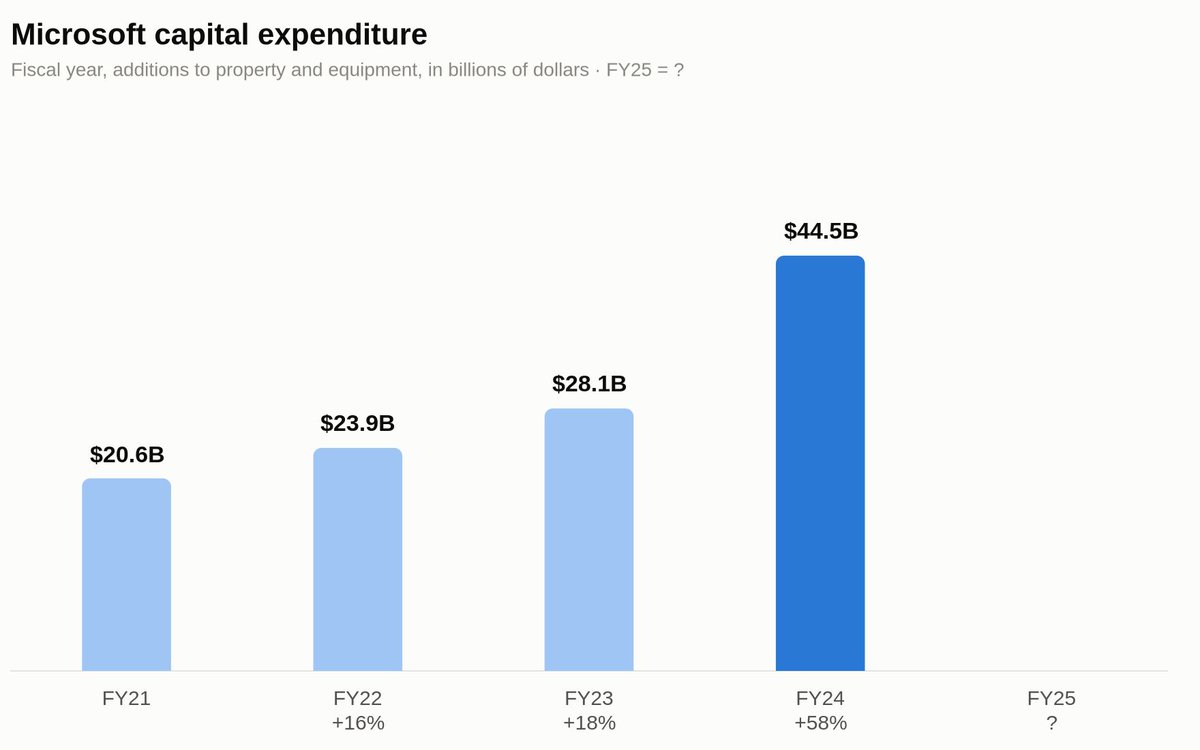
Microsoft's capital spending more than doubled between FY21 and FY24.
Additions to property and equipment:
FY21 $20.6B
FY22 $23.9B (+16%)
FY23 $28.1B (+18%)
FY24 $44.5B (+58%)
FY25 = ?
FY24 alone added $16.4B of new spending.
FY25 closed in June. Guess before you look it up.
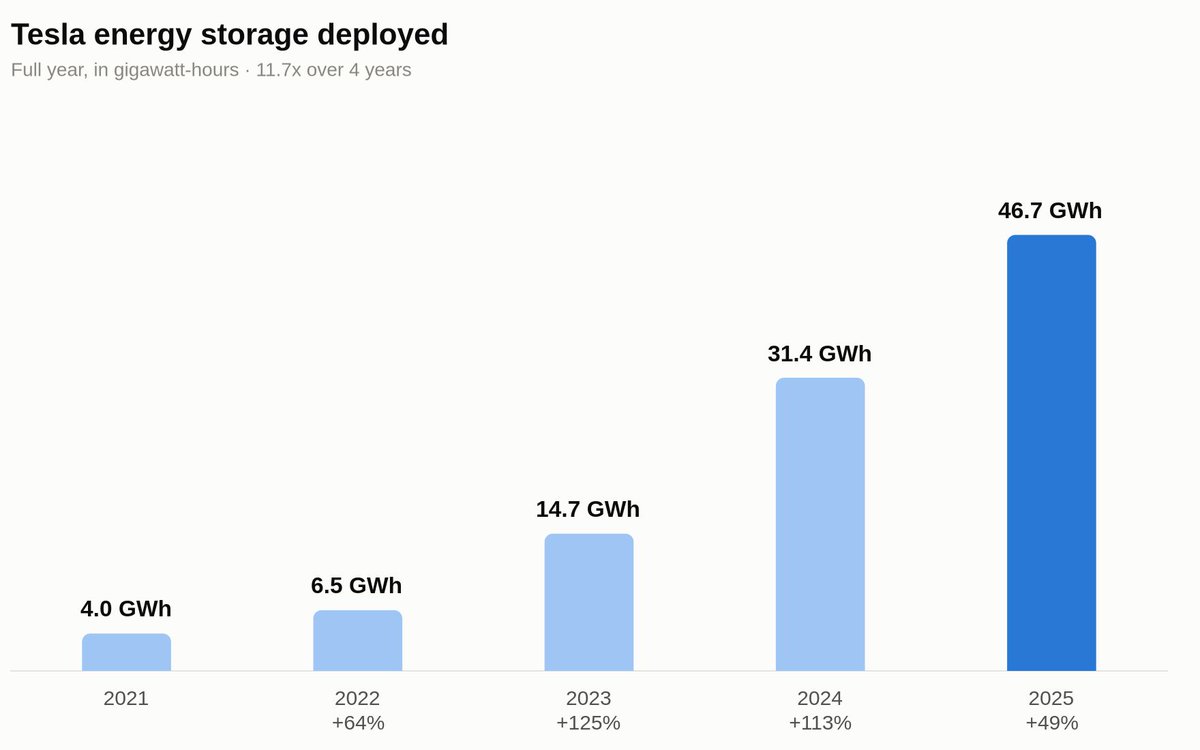
Tesla's energy storage business grew almost 12x in four years.
Storage deployed:
2021 4.0 GWh
2022 6.5 GWh (+64%)
2023 14.7 GWh (+125%)
2024 31.4 GWh (+113%)
2025 46.7 GWh (+49%)
Q4 2025 alone was 14.2 GWh, more than 2021 and 2022 combined.
Deployments pass 60 GWh in 2026.
NVIDIA's operating income fell 58% in fiscal 2023. It is now $130.4B.
Operating income:
FY22 $10.0B
FY23 $4.2B (-58%)
FY24 $33.0B (+681%)
FY25 $81.5B (+147%)
FY26 $130.4B (+60%)
Operating expenses last year: $23.1B, nine weeks of operating income.
It clears $200B in FY2027.
Google Cloud's Q4 revenue tripled in four years.
Q4 2020: $3.8B
Q4 2021: $5.5B (+45%)
Q4 2022: $7.3B (+32%)
Q4 2023: $9.2B (+26%)
Q4 2024: $12.0B (+30%) — 12% of Alphabet
Q4 2025: ?
Q4 op income: −$1.2B in 2020, +$2.1B in 2024.
No cheating — what was Q4 2025?
Microsoft cleared $279M of profit a day last fiscal year.
Net income:
FY21 $61.3B
FY22 $72.7B (+19%)
FY23 $72.4B (-1%)
FY24 $88.1B (+22%)
FY25 $101.8B (+16%)
Net margin: 36%. Nine months into FY26: $98.0B already.
Tonight's report: FY26 net income tops $130B.
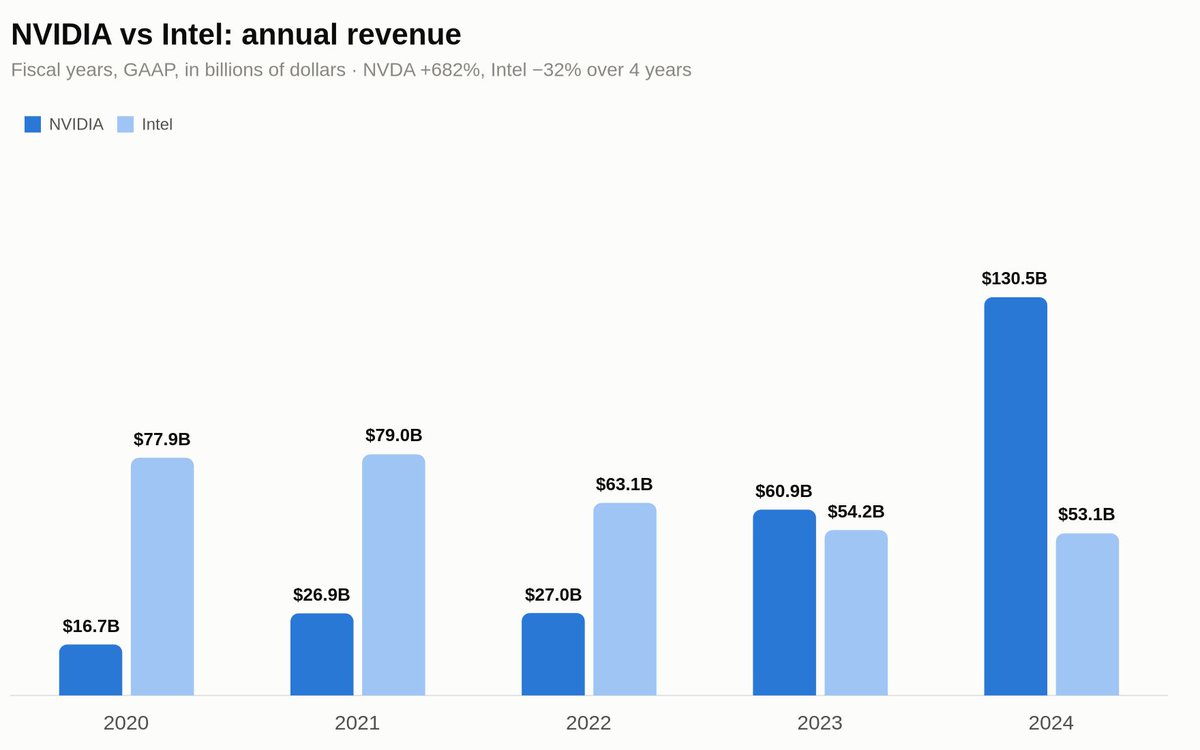
In 2020 Intel outsold NVIDIA 4.7x. Now NVIDIA outsells Intel 2.5x.
NVDA/INTC revenue, $B:
2020: 16.7/77.9
2021: 26.9/79.0
2022: 27.0/63.1
2023: 60.9/54.2
2024: 130.5/53.1
+682% vs -32% in 4 yrs. NVIDIA's $81.5B op income tops Intel's revenue. The better business rents its fabs.
Berkshire's insurance investment income nearly tripled in 3 years.
In 2024 it out-earned BNSF and BHE combined ($8.8B).
2021: $4.8B
2022: $6.5B (+35%)
2023: $9.6B (+48%)
2024: $13.7B (+43%)
2025: ?
Total operating earnings 2024: $47.4B.
Guess before you look it up.
NVIDIA went from zero buybacks to $53B repurchased in three years.
FY25 buybacks ran 40x its dividend.
FY22: $0
FY23: $10.0B
FY24: $9.5B (-5%)
FY25: $33.7B (+254%)
FY26: ?
Behind it: FY26 operating income $130.4B, a 60.4% margin.
No cheating — what was FY26?
Berkshire's insurance investments earn 2.6x what they did in 2021.
That $12.5B beat BNSF and BHE combined ($9.5B).
2021 $4.8B
2022 $6.5B (+35%)
2023 $9.6B (+48%)
2024 $13.7B (+43%)
2025 $12.5B (-8%)
Underwriting profit added $7.3B on top.
Prediction: 2026 comes in under $11.5B.
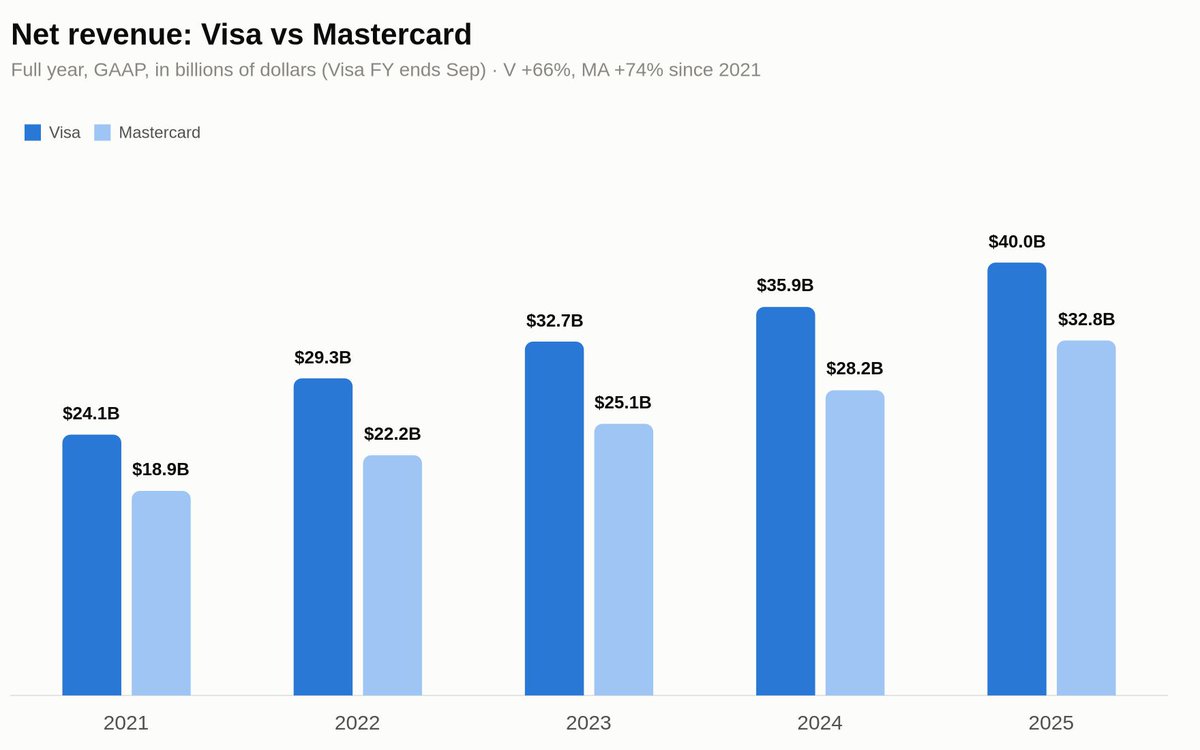
Mastercard has outgrown Visa three years running.
Net revenue, V | MA:
2022: $29.3B (+22%) | $22.2B (+18%)
2023: $32.7B (+11%) | $25.1B (+13%)
2024: $35.9B (+10%) | $28.2B (+12%)
2025: $40.0B (+11%) | $32.8B (+16%)
Op margins: 60% vs 58%.
Mastercard is the better business.
Rate hikes flipped JPMorgan's revenue mix in four years.
In 2021 fees beat interest, $69.3B to $52.3B.
Net interest income
2021 $52.3B
2022 $66.7B (+28%)
2023 $89.3B (+34%)
2024 $92.6B (+4%)
Guess 2025 before you look it up.
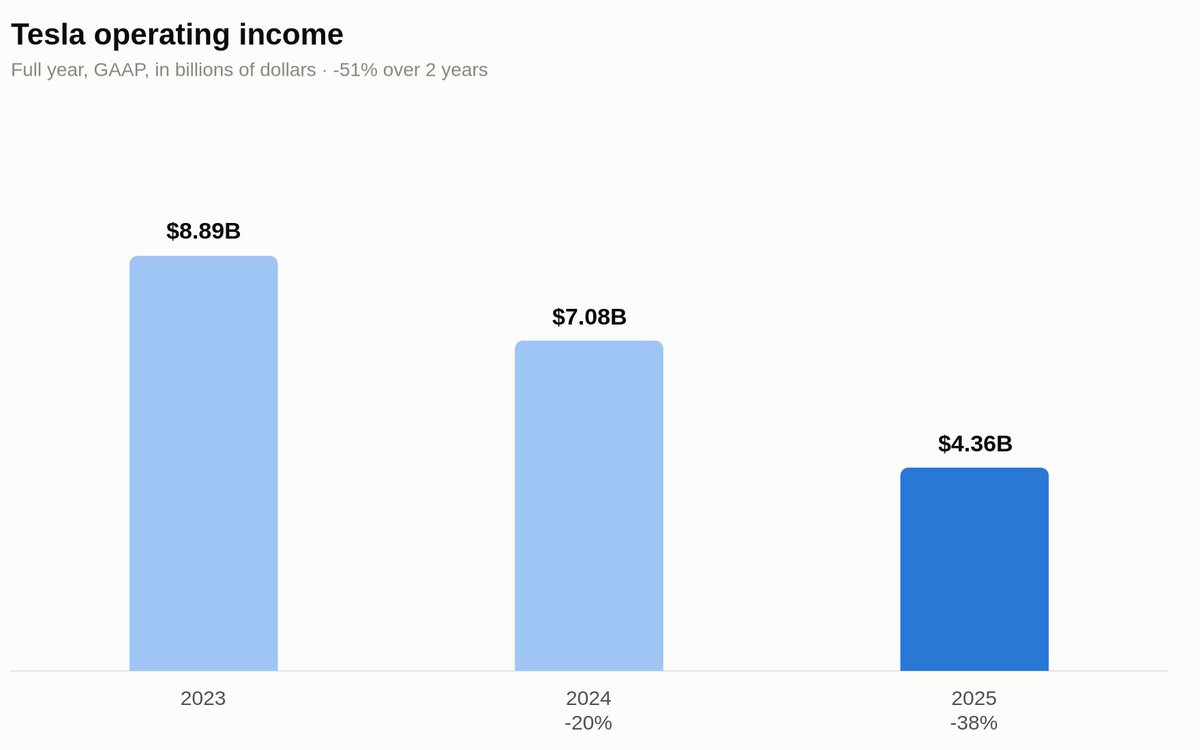
Tesla's operating margin halved in two years.
Revenue fell 2% over that span; operating income fell 51%.
2023 $8.89B
2024 $7.08B (-20%)
2025 $4.36B (-38%)
Operating margin 9.2% to 4.6%. Diluted EPS $1.08.
The robotaxi pivot is showing up in costs, not revenue.
Meta added $115B of annual revenue in five years.
Reality Labs is $2.2B of the $201.0B total.
2020 $86.0B
2021 $117.9B (+37%)
2022 $116.6B (-1%)
2023 $134.9B (+16%)
2024 $164.5B (+22%)
2025 $201.0B (+22%)
Op income $83.3B, 41% margin.
The metaverse pivot never reached revenue.
AWS is 18% of Amazon's sales and 57% of its profit.
Retail: $588.2B sold, $34.4B earned. AWS: $128.7B, $45.6B.
AWS operating income
2022 $22.8B
2023 $24.6B (+8%)
2024 $39.8B (+62%)
2025 $45.6B (+15%)
35.4% AWS margin vs 11.2% company-wide.
Retail now exists to fund the cloud.
Alphabet's profit more than doubled in three years.
One year of it tops Comcast's 2025 revenue ($123.7B).
2021 $76.0B
2022 $60.0B (-21%)
2023 $73.8B (+23%)
2024 $100.1B (+36%)
2025 $132.2B (+32%)
Margin 26% → 32% on $402.8B of revenue
Operating income rose 15%, net income 32%.
Microsoft revenue, last five fiscal years:
FY21 $168.1B
FY22 $198.3B
FY23 $211.9B
FY24 $245.1B
FY25 $281.7B
Nearly double FY20's $143.0B — up $138.7B in five years. FY25 operating income was $128.5B, a 45.6% margin.
Apple spent $90.7B buying back its own stock in FY2025 — 81% of its $112.0B net income.
Over the last six years: $511B in buybacks.
Revenue: $416.2B. Services alone: $109.2B.
Source: 10-K, SEC EDGAR
Berkshire Hathaway's 2025 net income: $67.0B — down 25% from 2024's $89.0B.
The 5-year swing: 2021 $89.8B → 2022 −$22.8B → 2023 $96.2B → 2024 $89.0B → 2025 $67.0B.
Operating earnings: $44.5B, in Buffett's final year as CEO.
Source: 10-K, SEC EDGAR
NVIDIA closed FY2026 with $215.9B in revenue — up 65% YoY, and 13x what it made five years ago.
Net income: $120.1B
Data center: $193.7B (~90% of total)
Gross margin: 71.1%
Source: 10-K, SEC EDGAR