@owenlhjphillips Much appreciated. Finding that there such complexity in player transactions that such tidy data is probs near impossible. & I was hoping nba packages had meta player info so I could pull dob but it’s been tricky to find. Finding I’ll def have to harmonize from a few diff places.
Same plot concept but looking at the NBA. For some reason player transactions are so messy, so getting the start dates that players joined teams is so ugly. @owenlhjphillips Curious if you have suggestions for getting (clean) player 1) transaction data and 2) birthdays
A look at Real Madrid's age profile so far this season. Ancelotti forced to rely on 8 players who have stayed healthy... especially Valverde and R��diger who have beared the defensive weight given so many injuries.
#RealMadrid #LaLiga #Rstats
A look at Real Madrid's age profile so far this season. Ancelotti forced to rely on 8 players who have stayed healthy... especially Valverde and Rüdiger who have beared the defensive weight given so many injuries.
#RealMadrid#LaLiga#Rstats
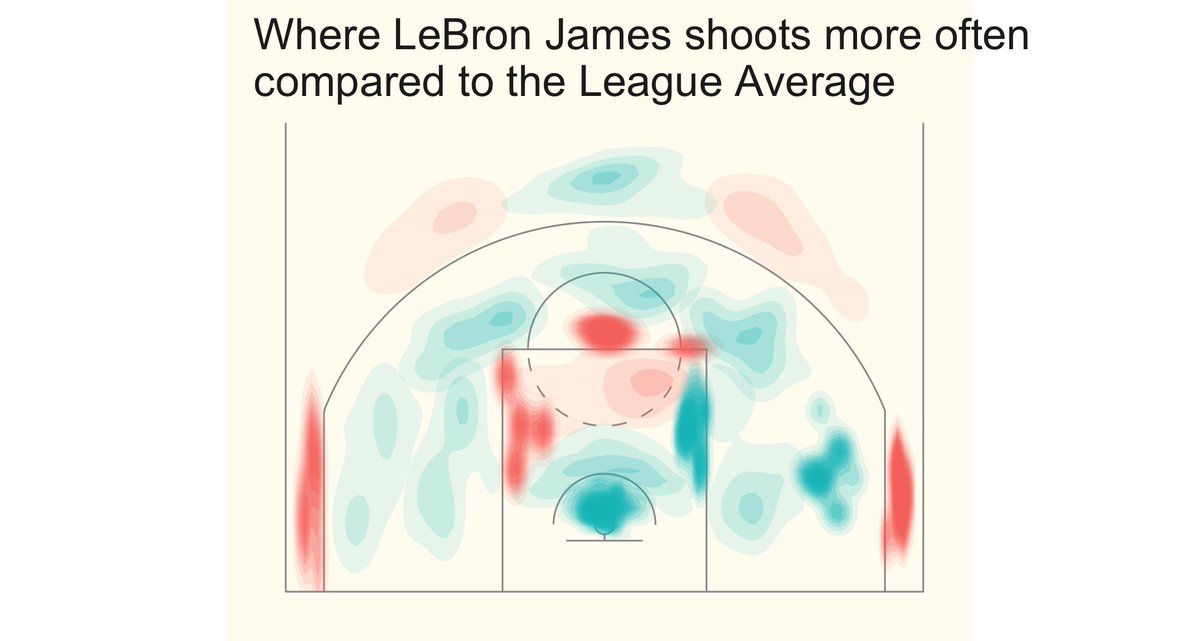
@owenlhjphillips Ah, I was only plotting the individual player's shots. So zones where the player didn't shoot as often didn't have enough volume to display in the "less than average" zones. Also assuming the "sqrt(z)" may refer to z-score as opposed to my using percent diff... wheels are turning
@owenlhjphillips Is there a reason you plot the above and below league average densities separately? Prob easier to set the colors, but curious if there’s another purpose (ie better for density levels or something)
Tried to replicate this but just for LeBron, this is as far as I got in an hour or two and need to go to bed.
Mainly had to get caught up with getting the data in, ended up using @todd_schneider's {ballr}.
@owenlhjphillips Your contours are so clean, any geom tips?
@owenlhjphillips If you want to really have fun, you should compare the delay in start times between general MLS games vs EPL/La Liga/etc… MLS is awful. I hypothesize MLS is +20min vs <3min elsewhere in the world.