Gold has touched its last weekly support on one of my top indicators.
As long as it holds support, the weekly trend remains positive.
Risk tends to be lowest near support because that is typically where risk management is applied.
#Gold
Attached is my call on Silver from February 2026, when it was trading above $100.
It has since come down as indicated.
Around $55 appears to be a strong weekly support level.
In my view, its weekly uptrend is weak but not broken yet.
#Silver#Preciousmetals
Sharing this oscillator publicly for the first time.
The chart shows Bitcoin’s price action over the past 10 years, with the following annotations:
- Green lines and circles: Historical bottoms as identified by the oscillator
- Red lines and circles: Breakdown zones
- White circles: Key support levels
Currently, the oscillator is registering readings that align with those observed at previous major lows.
This is shared strictly for educational and technical discussion purposes.
#Bitcoin #BTC $BTC #Crypto
Altcoins' dominance has begun over BTC.
How long it'll last depends on the trend of BTC dominance chart.
For now, I would announce the beginning of good time for Altcoins (of course, not all but selected).
Not to forget - this X account called the correction in January and the bounce last month.
We’re all on the right side of the market... no surprises!
Your support keeps me going.
Have you said thank you to me yet? 😄 Just kidding!
#Crypto
Today is a historical day for the crypto community.
NASDAQ index is down 5%
Gold is down 3%
BTC is up 1% and rising.
For the very first time, I've seen such diversion.
Very very important milestone. 💪
#Crypto#Bitcoin
Let’s understand the last 60 years of US inflation (Core PCE) data with a simple approach (the Fed uses this):
1. Red rectangle – Represents the 1970s, the worst period of high inflation.
2. Blue rectangle – The current inflation trend period.
White circles – Points where inflation bottomed before rising sharply.
3. Green horizontal line – The Fed’s target inflation level.
Yellow horizontal line & red circle – Marks where the second leg of inflation began in 1973.
4. Blue circle – Shows how current inflation has returned to a similar point as in 1973.
The current inflation rate is 2.6% (m/m). I believe the Fed wants to see it at 2% to ensure there’s no repeat of 1973, where inflation surged after hitting the yellow line.
👇
I wouldn’t assume history will repeat unless we see a rise in inflation.
The current trend is declining—and that’s what matters.
Please repost if you liked it.
#Inflation #CorePCE
Here are my reasons:
1. Short-Term Bond Yields
Three-month bond yields are declining, and further drops could shift money market funds into stocks and crypto. The attached chart shows yields nearing critical support, suggesting a potential breakdown.
2. Gold Showing a Top
Gold appears to be peaking, which could free up some hedged capital.
3. Pro-Crypto Administration
The current government is supportive of crypto policies.
4. Contained Inflation
Inflation remains under control. The second attached image shows a continuing decline in inflation.
5. Improvement in the Ukraine–Russia Conflict
The situation is showing signs of stabilization.
6. Energy Costs
Natural gas has peaked, and oil around $75/barrenl, that helps reduce energy price pressures.
7. Japanese 10-Year Bond Yields
The 10-year Japanese bond yields appear to be topping.
8. Reduction in Quantitative Tightening (QT)
The Federal Reserve is easing QT, nearly halting it.
9. Future Rate Cuts
The Fed is planning two rate cuts for 2025.
US 10year yield update:
Added one of my indicators showing how it is acting as a resistance (marked with a red cross)
Yields are dipping after Fed's updates.
This is good for Crypto.
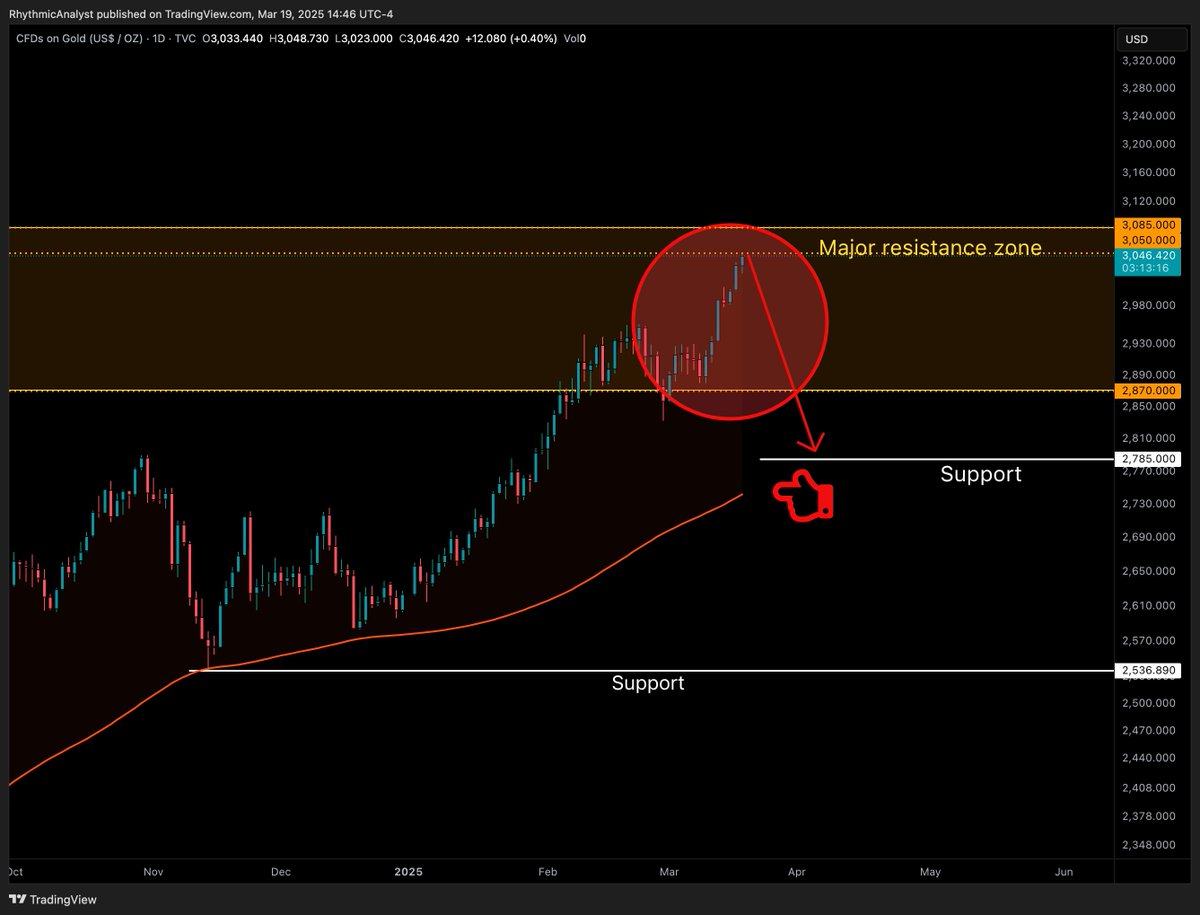
Gold update:
I’ve added one of my technical indicators (the red line), which acted as support during the November 2024 drop.
Extending it further, it lines up with the support level I calculated manually, creating a 'hot spot' around 2,785 USD.
#Gold
BTC bounced perfectly off the support level. 🔥
Refer to the attached call from March 10.
At that time, the market was extremely bearish, but we identified a bottom—and it appears we were on the right side of the trade. 👍
#BTC $BTC #Bitcoin
Here is a breakdown of my TA contents:
📈📉 On X (free) : long term trend analysis
💎 On Discord channel (paid) : M-Call :
You get accurate calls with support and resistance levels.
🪙 On Discord channel (paid): M-Club:
You get a quality technical indicator which works on all types of asset classes (it's like a weather app for assessing health of assets).
✅ Additionally, on our Discord channels, you'll have the opportunity to discuss various topics with me and connect with like-minded people.