I read Future Shock in my home in Baltimore maybe around 1971 or '72, when I was 14 or so.
Explaining: I was #9 of 10 in a very political family. One of my sibs, probably Mary, (the oldest), bought it in a bookstore and brought it home.
But my mother was a subscriber to William F. Buckley's National Review (every 2 weeks), and we watched his show Firing Line on PBS. (It was a media desert for conservative thought in those days.) Buckley and a bit later Pat Buchanan were about as good as it got.
I wish we had listened to PJB. Oh, how.
⚡️⭕️ The Yemeni ground war just started and neither side can build outcomes after the first week of the war despite the changes on the ground
Ansarallah made large advancements on the coast, but they have to solidify those gains first for us to consider it a fait accompli
Too early to make final assessments
@gulfcoastseo@drealbigvirg This guy is a fraud. I read his book is good reading book.
And many other frauds: Tommy Robinson, Dan Pena, Dan Look, Grant Cardone and people still fall for it.
Illusion, this is controlled opposition. Trump gave him huge exposure with his tweet.
Real opposition is cancelled, obliterated.
In a few weeks time, Alex will be backing again the system.
Same as Elon Musk had a rift against Trump and a few weeks later they were partying together.
This is entertainment for the masses.
If you are looking for projects to DYOR - start with those who are actually building SOMETHING during the bear
This kind of projects tend to shine once the liqudity is back to the game.
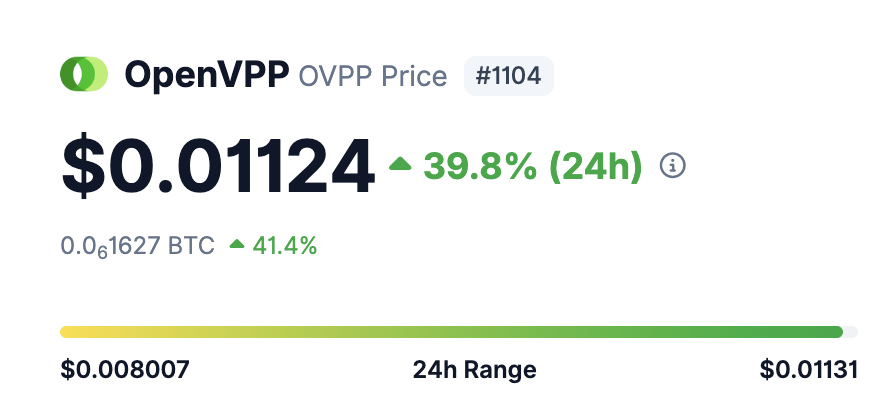
$OVPP + 40% is a nice start 😉
‼️🧵 "Feint and Fix"
1/
To this day, few people — even among the supposed "expert" class of military analysts — understand that the Russian move against Kiev in 2022 was a deliberately planned and expertly executed "Feint and Fix" operation (as I explain in the article below).
Tools I would suggest new traders to start learning First.
1. FRVP (LVN/HVN)
2. CVD
3. VWAP
4. ATR
5. Bid/Ask Depth
6. OI Spot Ratio
7. RSI (for momentum divergence only)
8. EMA for trend only.
9. Stop loss Heatmaps (not liquidations)
10. TPO charts for scalps.
@milman2025 Active X, dev updates, large amount of buybacks, excited community, decent roadmap, team members In TG…
And you want to look for charts that have moved off the absolute bottom and held well for a bit.
I genuinely believe you can make big money in the next year without reinventing anything using this method:
- Stop aping every fresh low cap
- DCA into majors during boredom ( $BTC, $ETH, $SOL)
- Bet more tokens at 5-10mil + rather than 500k mc
- Trade low caps only when volume + attention return
- Log in and show up every single day
- Take initials always after 2-4x
- Never sell or buy everything at once. Do it slowly
- Get rid of losers, but try to always have some dust
- Swap low cap profits to majors instead of only stables
- If you buy PvPs, make sure to hold both of them
- Work for your bags
Let's win 💪
I'm already starting to see it...
We have the "Bottom is in LFGGGG" and then the "Dead cat bounce lower is coming" groups.
The fact is guys is that reversals are always dead cat bounces until they aren't.
And they always feel like a dead cat bounce until they're much higher.
Lastly, everyone finds it so hard to believe in a pump after weeks of down, so people hesitate.
And in the end, Bitcoin climbs "the wall of worry"...
Then by the time the majority actually believe again... price is 25% higher, they buy in.... and then it dumps!
Buying bottoms is very hard for all of the above reasons...
And it's difficult to know when they're in.
But once we have some price action to look back on, it starts to make it clear, although it is still not 100%... it never is.
But this is what I look for and here is what I'm seeing.
1. Strong downtrend with steep rising sell volume, making lower lows
2. Eventual bottom with large volume spike
3. The first lower high
4. Impulsive PA starts backed up by now rising buy volume
5. OBV broke higher before the price did, which is bullish
6. The first break of downtrend and a higher high.
You can also see that I have highlighted some areas of flat volume, where we can see the rally failed both times.
Again, it is early days, and no one can gaurantee you something 100%, we can only look for the signs.
Next resistances are $98k/$100k and then $106k.
So far it looks good.
Have a great day champs.
This is a big one.
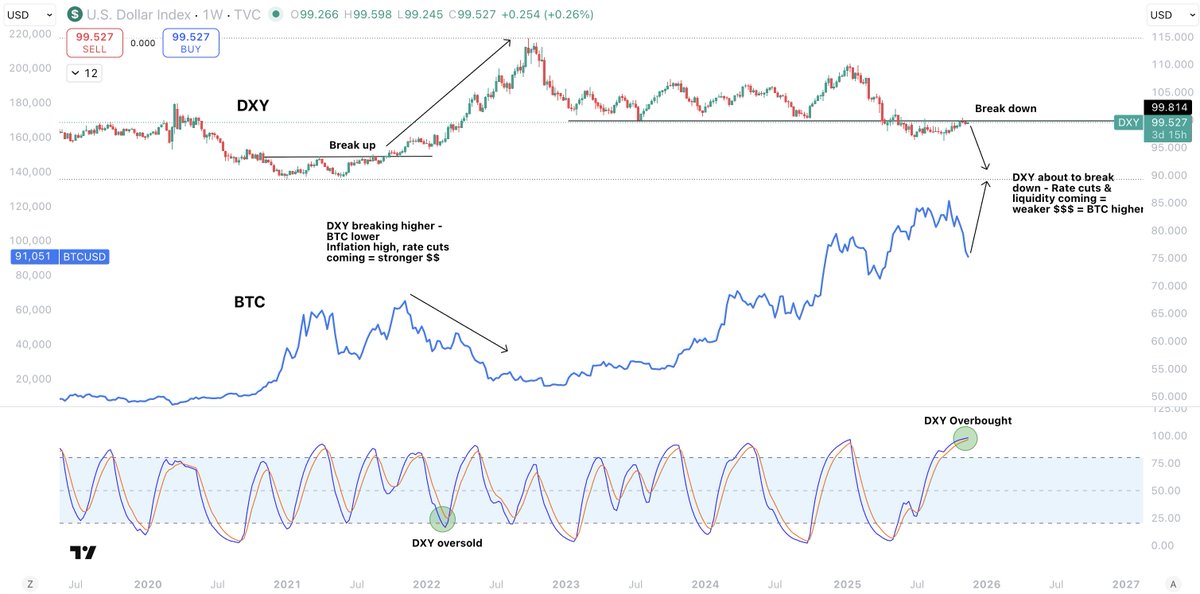
The DXY is heading nicely below 100 in my opinion.
And it is right at key resistance now.
Again, this is a totally different situation to the end of the bull market in 2021.
As we topped out in 2021 inflation was mooning and the FED was making preparations to increase rates and reduce their balance sheet, which strengthened the dollar = DXY up + risk assets down.
But right now we are heading towards balance sheet expansion and lower rates = DXY down + risk assets up.
BTC and DXY have an opposite correlation.
This is because when DXY is stronger, investors park their cash in the high yielding dollar.
When DXY is weaker, they seek other avenues to park their money.
And right now, we have $7.5tn in money market funds that will look for a home as DXY continues to weaken.
We can see from the position of the DSS Bressert stoch that in 2021 DXY was oversold, ready to run.
Now, its overbought, ready to drop.
To summarise this simply:
End of 2021:
- After of $3tn stimulus expansion
- Bank reserves record high $4.1tn(excess)
- Inflation rising fast
- Interest rate hikes coming
- Balance sheet reduction starting - QT coming
End of 2025:
- After $2tn balance sheet reduction
- Bank reserves $2.7tn(almost at lower limit)
- Inflation steady and low
- Interest cuts coming
- Balance sheet expansion starting - QT ending
This has been a very sudden and harsh correction, but from everywhere i look, this is a "close to the end" of cycle correction...
But not the end.
Be good to yourselves and others, frens.
Altcoins are gearing up for mega expansion.
This setup here could not be any cleaner.
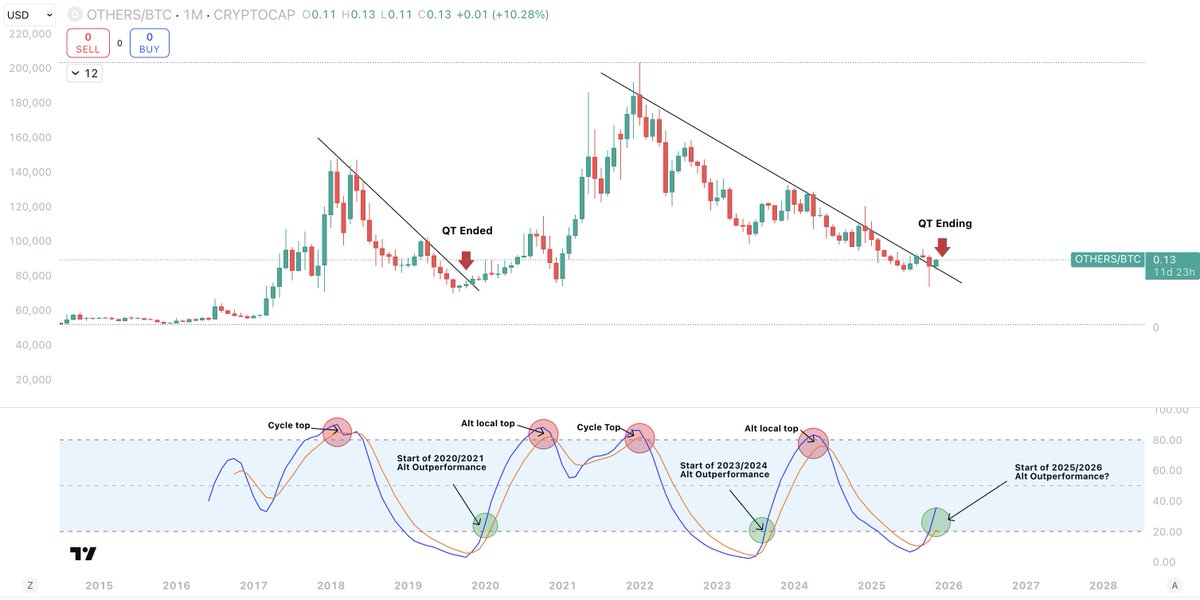
And this is the purest form of alts within the OTHERS/BTC chart.
The only difference with this cycle, compared to 2017 and 2021, is within the time it has taken to reach this point, compared to the last cycle.
Which, is totally connected to the fact that we have been in the largest business cycle contraction ever.
Everything is about liquidity, and the charts are signalling its impending arrival.
What we have here should be pretty damn easy to see..
But let's go over it.
A clear break of the 1M downtrend exactly around the time QT stopped last time, and is set to stop this time.
The DSS Bressert indicator perfectly calling every single altcoin local top/top and every single local bottom/bottom.
It has only ticked up from the bottom three times in the last 6 years, and each time has been at the beginning of the last areas where altcoins truly outperformed.
Tell me frens... does this chart look like a cycle top to you?
We then have the indicator calling every single local top/actual top on altcoins and the overall market.
This includes 2017, 2021, and the alt szn at the end of 2023 into 2024.
Again, does where it is now look like a cycle/altcoin top?
Not at all.
The evidence of where we actually are in the cycle is staggering, and I am sharing a whole lot of it with you.
It is not hope, it is not a dream.. these are HTF fundamental charts that tell a very clear story.
We are not at the end for altcoins... we are at the beginning.
They have been in a bear market against Bitcoin for over 4 years.
And they are now finally entering the expansion phase.
Again, as I have shared with you, this all perfectly lines up with the macro situation.
There is no coincidence this is all coming together just as QT is ending and liquidity contraction is finishing.
You can see this in BTC.D, ETH/BTC, TOTAL3/BTC and OTHERS.D.
I have shared all of these with you, and they all show the same thing.
Large altcoin expansion is on the horizon, and the market top is not in.
You can choose to ignore all this data and listen to the doom callers if you like, but you would be wise not too.
And as I keep saying, this is not my opinion...
These are objective facts that I have signalled here as clearly as i can so you can understand it.
Here is what you all need to understand.
I'm going to explain this in detail for you so you know where we are, and why this is nothing like 2021.
Bitcoin, and the rest of the market, are liquidity vessels.
Their cycles are NOT dependant on an arbitrary 4 year number.
But they ARE dependant on the wider liquidity and business cycle, which is totally different this time.
And you can see here on this chart that BTC mirrors exactly the:
- COPPER/GOLD chart
- ISM/PMI chart
So what are these?
The COPPER/GOLD chart is one of the best indicators to understand that state of the economy.
COPPER is one of the most widely used metals on Earth for almost all form of building and development.
When COPPER is pushing higher, it is because the economy is expanding and the demand for it is high.
GOLD, is used as a hedge and safety trade, and when that is expanding, it is because the global market is shaky and people are keen for too much risk.
What this means overall is that when COPPER/GOLD goes up, COPPER is stronger because the demand for that is higher(expansion globally) and GOLD is trending lower, because everyone is more risk on.
You can see very clearly that when COPPER/GOLD goes up, BTC moves at the same time and always has.
At the bottom of the chart we have the ISM/PMI, which is the index used to understand whether the economy is expanding or contracting.
Historically, when this is below 50, like it is now, the economy is contracting.
When this happens, as you can see, COPPER/GOLD goes down and so does BTC.
Literally in unison.
And right now, we are in the longest contraction of PMI ever recorded.
When PMI ticks over 50, we enter expansion and COPPER/GOLD also goes up... and yes, so does BTC.
So what does this tell us?
Well, look at 2021.
COPPER/GOLD had been expanding for months and was topping out, just like PMI.
In 2021 we were at the peak of the business cycle and only massive contraction lay ahead.
Right now, COPPER/GOLD is bottoming and PMI is grinding up towards 50+.
All at the same time as we are about to come out of the longest liquidity contraction ever, and into easing.
Ask yourself...
Do you think this is all a coincidence?
That this has been the longest contraction cycle, and the longest COPPER/GOLD and PMI contraction also?
No, it is not.
And that is because ALL of this is linked.
The expansion phase of this liquidity/business cycle has not even properly got underway yet, and you can see this with your own two eyes looking at this chart.
The fact here is that BTC has been pushing higher in an overall contracting global environment, and as i keep saying, the only thing that has been pushing it higher has been institutions and government adoption.
The reason it is weak, totally different to any other bull market, and cannot sustain a true pump, whilst the altcoin market has been down only is because of what I have just told you here.
Todays conditions could not be more different to 2021...
I have made this crystal clear for you in this and many other of my posts.
If you think you are gonna get a 2022 bear market from here and you can sell or your bags now, add a massive 50x short, ride it easy, then chuck your profits into BTC at 75% down...
You're fucked.
Massive expansion is what lies ahead.
Not a deep bear market.
We are not in a distributive top.
This further backs up my claim.
This is some distribution but into HEAVY accumulation.
We have had OGs selling billions and we have been above $100k for 7 months now. 189 days.
Each previous top has given nowhere near that amount of time to get out.
Tops never, ever do.
2013: 21 days before break of structure and nuke
2017: 38 days before break of structure and nuke
2021: 96 days, which wasn't the market top
2021 actual top: 38 days before break of structure & nuke
We have now been consolidating above $100k for twice as long as any area of topping period we have ever seen(again, april 2021 was not the top).
And 5x longer than any actual final market top from any cycle.
Tops are violent and fast, trapping people in their bags and wiping gains quickly, forcing people to hold all the way down.
We have this $100k floor building
TOTAL coiling
TOTAL 2 & 3 bullish
BTC.D still at 60%
Nothing about this market other than a 4 year cycle number is saying top here.