🌱 How can small labs uncover the secrets of plant resilience in tough soils without expensive tech?
Affordable non-invasive machine-aided phenotyping identifies phenotypic variation to soil stress across the Arabidopsis thaliana life cycle.
https://t.co/hq3PYPGdor
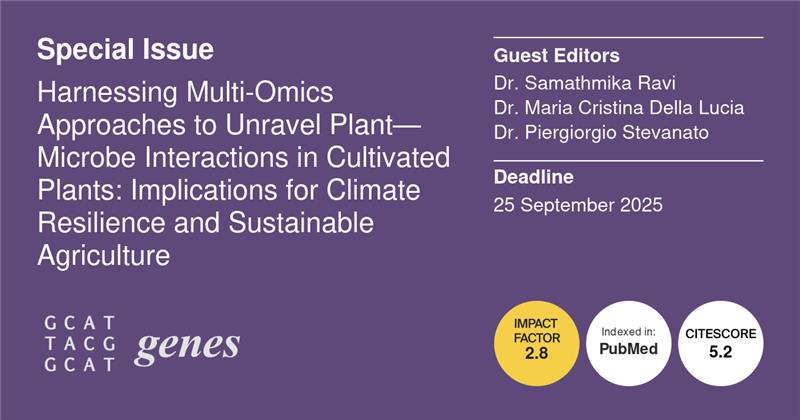
Special Issue, edited by Dr. Samathmika Ravi, Dr. Maria Cristina Della Lucia and Dr. Piergiorgio Stevanato from @UniPadova, is now open for submissions!
Deadline for submissions: 25 September 2025
Read more about it at:
https://t.co/WY1EuDpNlY
Understanding the difference between Standard Deviation (SD) and Standard Error (SE) is crucial for accurate data interpretation. SD measures the variability within your data, indicating how spread out the individual data points are from the mean.
In contrast, SE measures the uncertainty around the sample mean as an estimate of the population mean. It reflects the precision of the mean, with SE decreasing as the sample size increases, making your estimate more reliable.
The relationship between SD and SE is given by the formula: SE = SD / √(sample size). While SD remains relatively constant with larger samples, SE diminishes, highlighting the reduced uncertainty in the mean estimate.
A common mistake in research is using the “±” notation without specifying whether it refers to SD or SE, leading to potential misinterpretation of the data. Clear distinction is essential for transparency and accuracy in reporting.
Key Takeaways:
• Use SD to describe data variability.
• Use SE to indicate the precision of the mean.
• Always specify which measure you are reporting.
More than 40 percent of #postdocs leave academia. Those who landed a coveted faculty position were more likely to have had a highly cited paper, changed their research topic between their #PhD and postdoc, or moved abroad after receiving their doctorate. https://t.co/SkU2JVisuu @PNASNews -> https://t.co/GZKmXombKN #ScienceCareer
♻️🆓: Uncovering genetic control of primary root length variation in Brassica napus using QTL-seq. A commentary on: ‘Rapid identification of a major locus qPRL-C06 affecting primary root length in Brassica napus by QTL-seq’
https://t.co/lBi5sbN2n0
New collection: "Diffusion barriers in plants" https://t.co/GZv04mR03d
Biogenesis of diffusion barriers like Casparian strip, suberin lamellae or root exodermis. Primarily focused on root diffusion barriers, but homologous structures were recently discovered in trichomes.
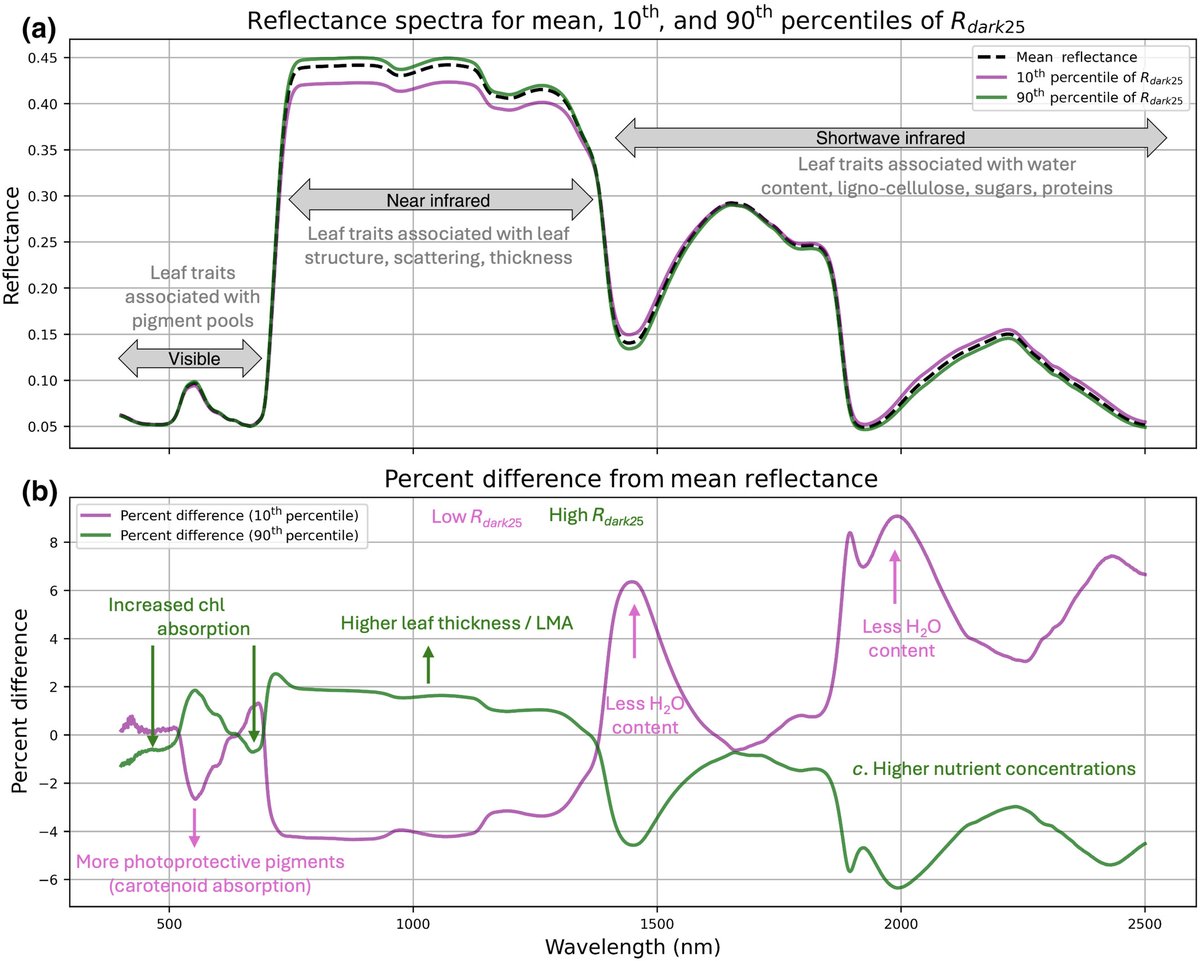
#Hyperspectral reflectance integrates key traits for predicting leaf metabolism
📖 https://t.co/q7f788zpcc
#Commentary by @troymagney highlighting the recent work by Wu et al.
📖 https://t.co/S6wEGd8rGc
Ever wondered about the difference between Principal Component Analysis (PCA) and Factor Analysis (FA) in simplifying your data? While both are powerful techniques for reducing dimensionality, they serve distinct purposes in data analysis. Let's break it down:
PCA: Simplifying Complexity 📉
- Objective: PCA transforms your data set into fewer dimensions by focusing on maximizing variance, helping to simplify complex data without losing critical information.
- Use Case: Ideal when you want to reduce data complexity or prepare data for further analysis, such as clustering.
Factor Analysis: Uncovering Latent Variables 🔍
- Objective: FA goes deeper by identifying underlying factors or latent variables that explain the observed correlations among variables.
- Use Case: Best suited for exploring data structure or identifying hidden dimensions influencing data patterns.
Key Differences:
- Focus: PCA concentrates on variance, while FA focuses on the underlying structure.
- Assumption: FA assumes there are latent variables influencing the observed variables, a step further in interpretation than PCA.
Why It Matters:
Choosing between PCA and FA depends on your analysis goals. Looking to reduce data for efficiency? PCA is your go-to. Curious about the underlying factors driving your data? Turn to FA.
Want to master these techniques in R programming? Explore our course on how to use PCA in R programming.
Further details: https://t.co/DUfoAHuxxD
#RStats #Python #DataScientist #datascienceenthusiast #DataAnalytics #database #rstudioglobal