Selalu di buat Mindblowing dengan Gebrakan si Ryker ini.
Kemarin dia Short $GOLD di $4600 sebelum trump ngoceh bikin harga dump
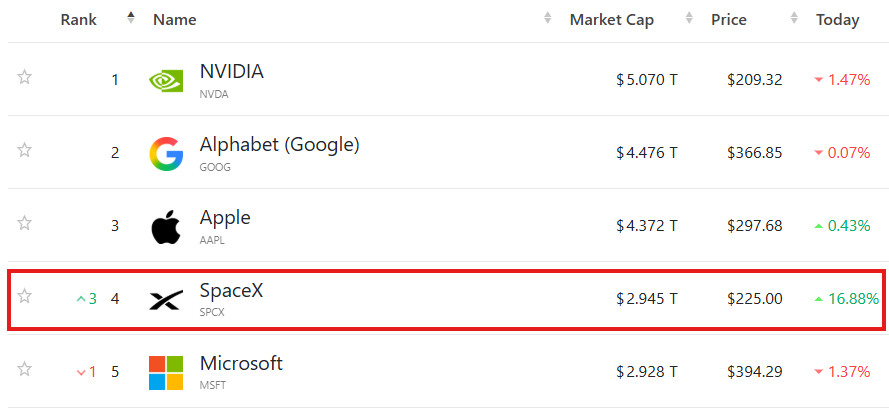
Lalu dia kasih tau hati hati sama $SPCX di harga $170 dan sekarang harga nya turun jauh, padahal Ansem ngasih tau Buy tapi dia sebaliknya. selalu lawan arah yang lagi ramai tapi suka bener
Next plan dia mau beli Gold di $3700 sama SpaceX di $129 siap siap ya antri.
he knows something that we don't.
GOAT
WARNING:
THIS PATTERN HAS NEVER BEEN WRONG.
Three bubbles.
Three crashes.
Now the AI bubble has reached the same stage.
And SpaceX could be the final top signal.
Most people will only see it after it’s too late.
BREAKING: Over $500,000,000 liquidated from the cryptocurrency market in the past hour.
• $BTC: $61,100
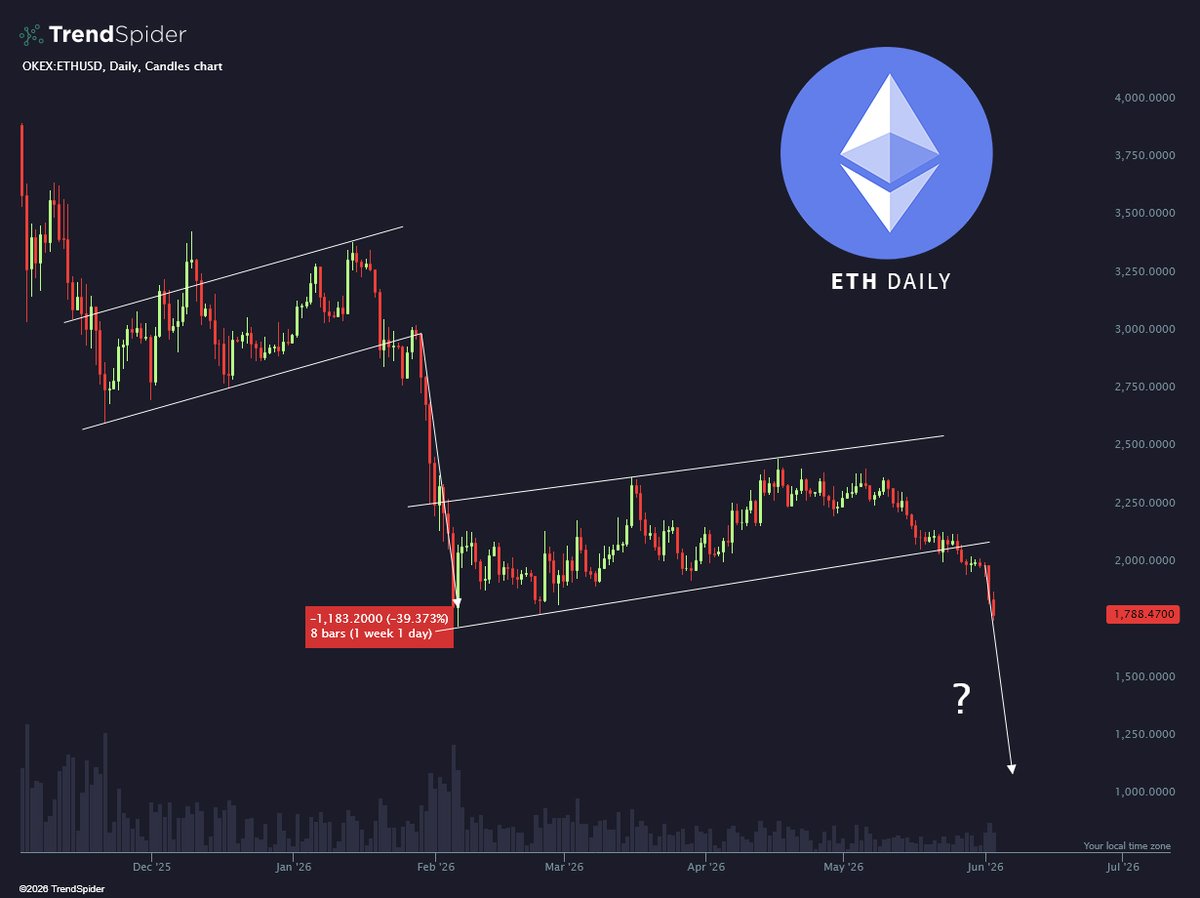
• $ETH : $1,620
• $BNB: $570
• $XRP: $1.10
• $SOL: $64
MACRO ECONOMY IS IN BIG DANGER!
First and more importantly, no matter when the recession crash happens, either in the next weeks or in Q1-Q2 2026 as described below, the 90-94k Bitcoin target remains regardless!
The yield curve is one of the best leading indicators of the economy. It compares the interest paid on short-term US government bonds (2-year) with long-term bonds (10-year). Normally, long bonds pay more because you are lending for longer. That’s called a positive spread. When the opposite happens and short bonds pay more, it’s called an inversion. An inversion signals that investors expect trouble ahead and that the Fed will be forced to cut rates.
The yield curve (10Y–2Y) inverted on July 5, 2022 and stayed inverted for 784 days, the longest inversion in U.S. history. Every single recession of the last 50 years has been preceded by this signal. On Aug 27, 2024 the curve flipped back positive (+0.56%). History shows the crash comes ALWAYS after normalization, not during inversion. Same happened in 1990, 2001, 2007 and now most recently in 2024-2025. Looking back at history, the lag between normalization and the start of a recession (Market Crash) was always short. In 1990, the recession began about 180 days after the curve turned positive. In 2001, it took only 60 days. In 2007, it was around 180 days again. So historically the lag has been in the 2–6 month range, but this cycle the inversion itself lasted much longer than any other cycle in history (784 days). The Fed already began cutting rates before a recession started, similar to what happened in 2001. The labor market is only now starting to weaken, with unemployment rising to 4.3% and job growth heavily revised down. So this time the clock is running much longer, 550–650 days but history still says the outcome is the same. A recessionary crash is coming, only with a bigger delay. So as per the calendar when should it start? We are now entering the high risk area in which the recession (Market crash) is going to hit the markets hard. Now, till Q2 2026 is high risk area and the big crash is going to happen in this timeline. On top of it Bond market SCREAMS HIGH RISK: 10Y \~4.05%, 2Y \~3.47%. Falling yields + positive spread are not bullish. This is exactly what we saw before 2001 and 2007 crashes, “back to normal” that was actually the calm before the storm.
My Position
The last post about the Inversion/ Positive spread recession indicator is one more confirming indicator for the big downside move and many of you missed the MAIN point. The next decisive move is BTC tagging 90–94K. The plan has not changed and I’ve said it for a month: sell 10% of spot daily into strength and load shorts whenever the market offers the 115–125K distribution zone. Because price slipped below our main short window, we’ve already executed 70% capital sits in USDT/shorts, and the remaining 30% spot is waiting for a retest of the short zone to unload and add even more shorts.
That playbook is crystal clear. What happens after 90–94K? It’s too early to tell for now: either we print 90K and MOVE TOWARDS 140K before the recession crash, or the recession crash starts in the coming weeks, both events are highly likely and its early to tell. Again, 90-94k region is clear and this has to come. 90–94K gets hit. From there, depending on sentiment and short‑term signals, we either take the tactical 90K → 140K ride or sit tight in a very profitable short for lower targets if recession fear increases. Do not confuse the 90K correction with the recession leg, they are different events. 90K is coming regardless! If the crash timing is early–mid 2026, there’s room from 90K toward 140K before the top and the recession crash.
These are the following scenarions:
1. BTC will continue in its "Short area range", later on dump to 90–94K
2. A major recessionary crash, think 1990/2001/2008 is ahead. Timing risk is at max now and extends through June 2026. Even on a 90K bounce, any long we take will be treated as high‑risk and managed with high risk management, because I’m 99% confident the crash lands between now and Q2 2026.
I hope that makes it clear !
Month of May: running trades overview:
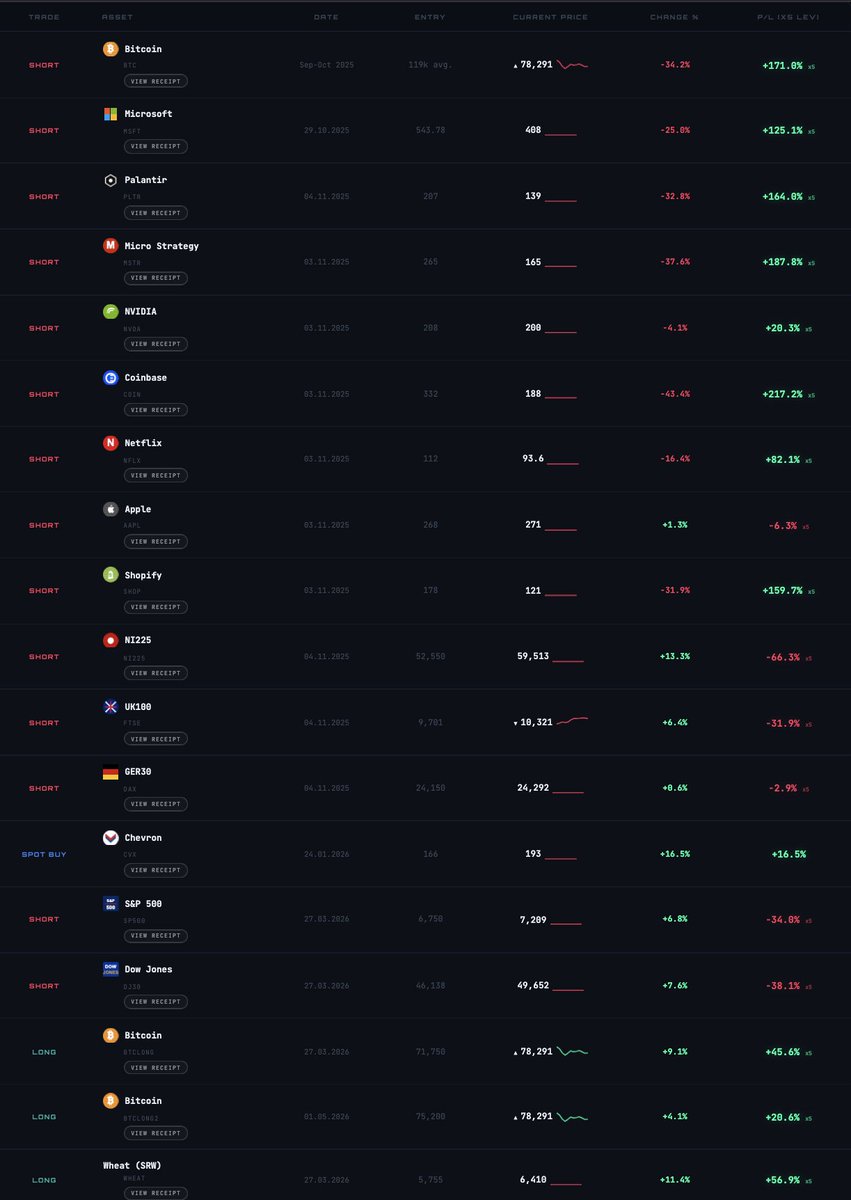
While entering the month of May, I am still holding the Bitcoin short from 120k, also multiple shorts of the stock market such as PLTR that was shorted at the exact top of 207 and held since 6 months+ for now. Some other positions have been opened recently, such as the SP500 short, the Bitcoin long at 71k, and two days ago a BTC long that was exclusively shared in premium only at 75,200, as well as a wheat long and 100 altcoin positions short that are not included in this list, and mainly all signals are exclusive for premium members only.
This is a monthly overview that is not an analysis model or something similar, but rather giving a clear and transparent overview of my current running trades, and I will continue to do so on the 1st of each upcoming month. Hope you like the idea. There are assets such as Gold and Silver, they are not included in the list as both are considered long-term trades, meaning I am buying and forgetting them. It's not futures or a trade I'm planning to close in months.
Gencatan senjata pada bulan April.
Selat Hormuz dibuka.
Trump menyatakan kemenangan.
Pembicaraan berlanjut.
Sell in May.
Eskalasi kembali.
Selat Hormuz ditutup lagi.
Ancaman senjata nuklir.
Market Kapitulasi.
Invasi darat.
China mengisyaratkan akan menyerang Taiwan.
Uji coba rudal Korea Utara.
BTC turun di bawah $50k.
Beli di Q3/Q4.
Print Money.
Perang berakhir.
Mid-term Election.
Bull Market dimulai.
Bitcoin – What’s Next?
The Big Sunday Report: All We Need to Know
🚩 TA / LCA / Psychological Breakdown: In February at 60k, I made it very clear that Bitcoin would stop its downtrend at that moment and that we would see a relief rally. Since then, Bitcoin went up to 75k (up by 27%) and is still moving within the current box formation. What many fail to understand is that Bitcoin, or any other asset, never goes up or down in a straight line. We always see in-between fluctuations of sideways movement or even short-term relief rallies.
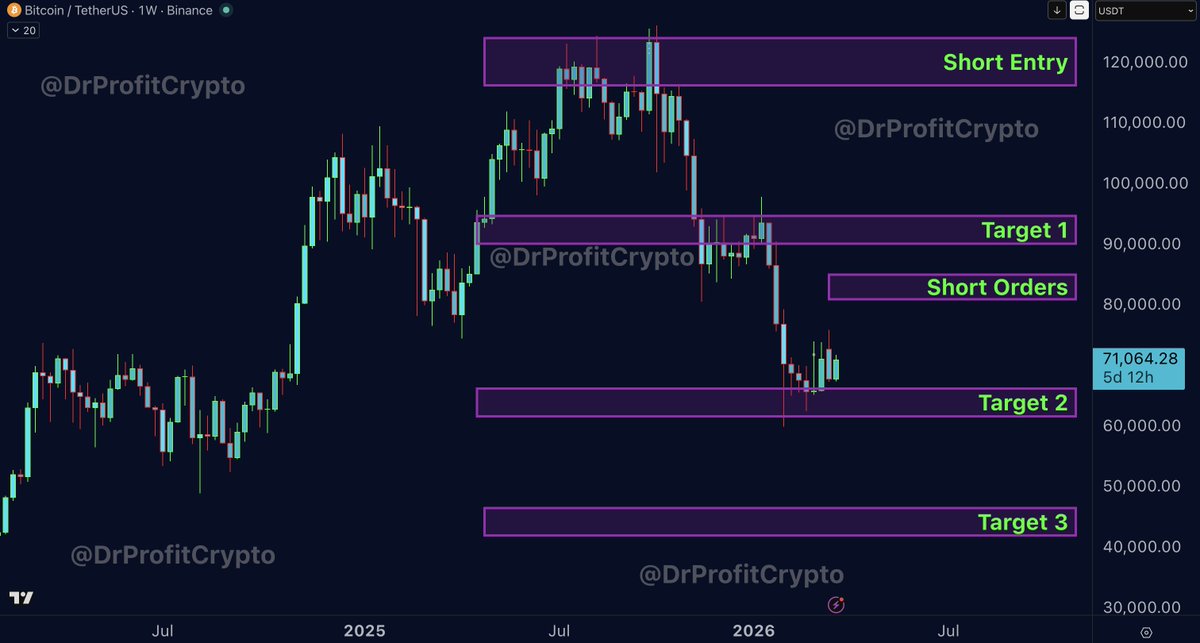
In this case, we have seen an upside of 27%. At this point, I don’t consider an entry attractive in terms of risk-reward, as I remain extremely bearish, but there is still room for upside and it is not off the table. So what does this mean for the current strategy? As mentioned in the last weeks Sunday report, the strategy has not changed much. We keep the short from 115–125k open, including adding short orders between 79–84k if the market allows us to revisit that zone. This means that if the market sees another rally, I will enter shorts in the mentioned area, buying and betting that we will reach those areas is something I would not do.
Is it certain that 79–84k will be reached? As mentioned, I have been observing these levels for two months and I see a slight high medium probability. However, due to the geopolitical scenario we are currently in, I consider the risk-reward NOT WORTH IT to be positioned in spot or in a long, even if those targets have a probability. Rather, I see Bitcoin in a bear market that has not bottomed yet. For that reason, placing short orders between 79–84k is, in my view, the much safer bet, with targets below 50k.
Join Premium: https://t.co/WAXkjQ12uM
#Bitcoin: The rule is very simple
Bitcoin has not bottomed out, 40-48k is coming
Potential of an upside move in the short term
For this reason, placed short orders at 79-84k
THE BIG SHORT – OVERVIEW
This overview shows ALL Big Short trades taken so far. Nothing is hidden. The list includes every single position, whether it is still open or already closed via stop loss, whether shared in public or in the premium membership only. In total, the Big Short consists of 14 trades. Out of those, 9 trades are currently in profit, while 5 trades are in small to medium drawdown.
Overall performance is very strong. Some positions delivered exceptional returns, such as +240% on the MicroStrategy short, +215% on Coinbase, +150% on Palantir, and +170% on Bitcoin.
The losing trades are limited and well controlled, especially when compared to the size of the winning trades. This is exactly how a strong short strategy is supposed to work: small losses, big wins. Keeping the shorts on stock open!
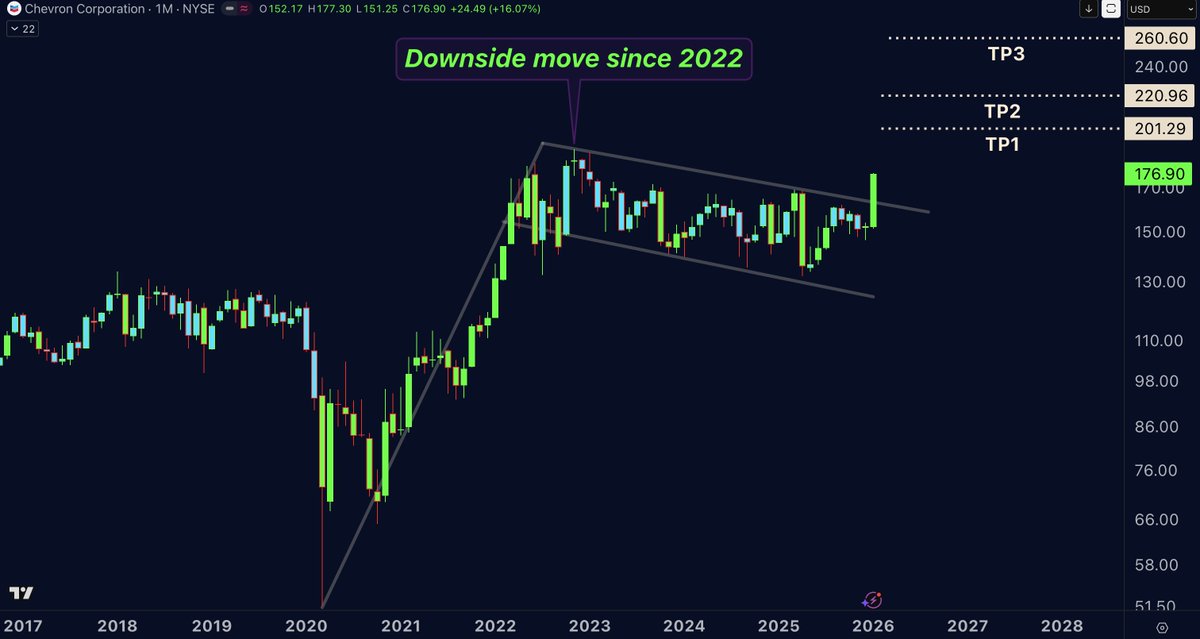
$CVX (Chevron Corporation Stock):
Since 2022, this stock has been trading in a sideways accumulation range, not a normal range, but one forming a gigantic bull flag. This bull flag broke out this week. All eyes are now on this stock. I have bought some. High potential to turn into a golden stock in the coming weeks. Let’s see where the party goes. Mid-risk trade, no financial advice. Despite my very bearish stance, there are still some stocks that can perform for many reasons this is one of them. I bought it.
This signal was shared in Premium a week ago at $166. It is already up 7% since I bought and shared it with Premium members. Whoever is not in premium is and will always regret!