I won't pretend I know what happens next cos I don't.
I've only bid the lows because I understand that either way we're really close to the end of this bull-market.
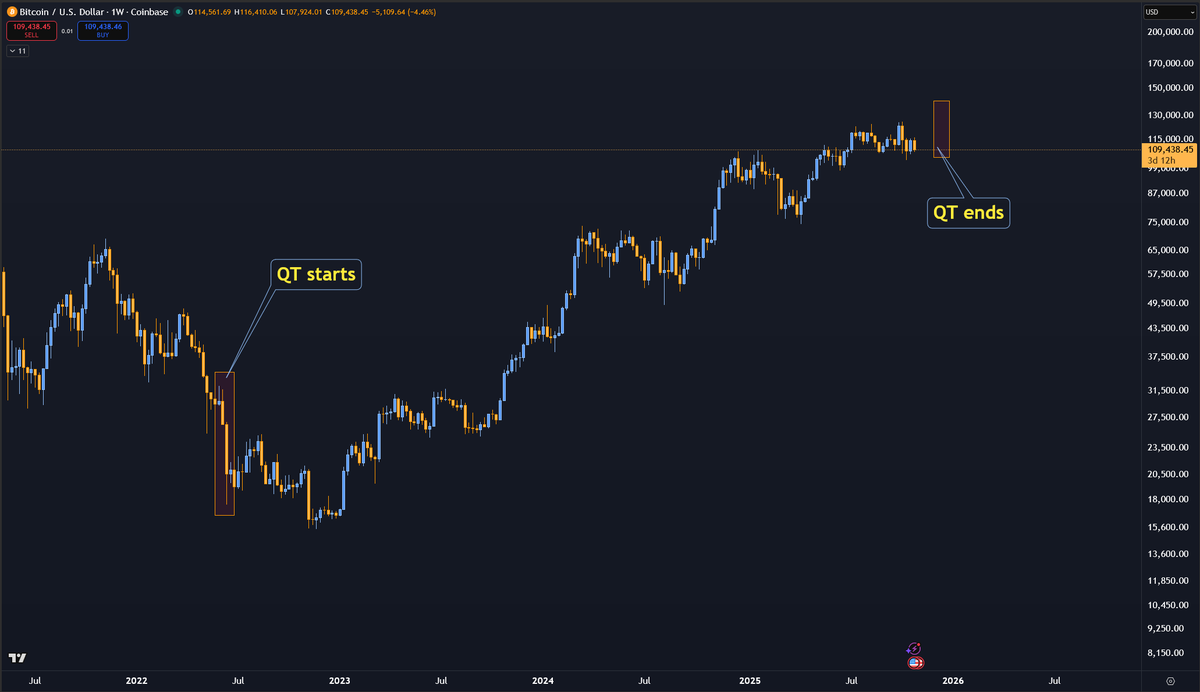
QT started in June 2022, very close to the market bottom, QT ends in December which could mark the market top.
Ideally bulls want to see a time-based low here, followed by a rally to new ATHs.
Closing a weekly candle below 2024 High + 2024 Weekly Highest Close would be a significant swift in momentum.
$BTC Sunday update:
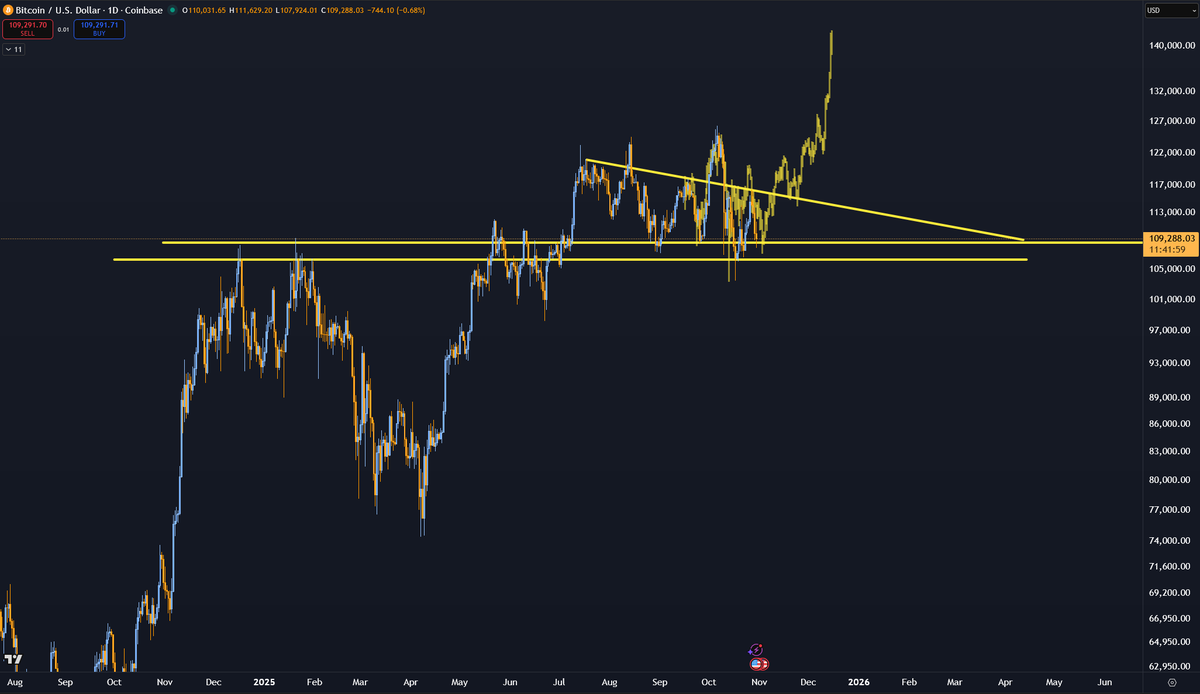
Is January's Price Action repeating now?
The reversal PA was almost identical at the highs since it's a common pattern for a pullback after reducing momentum.
However, the current situation is very different and it's unlikely PA repeats further:
🧵↓ (1/5)
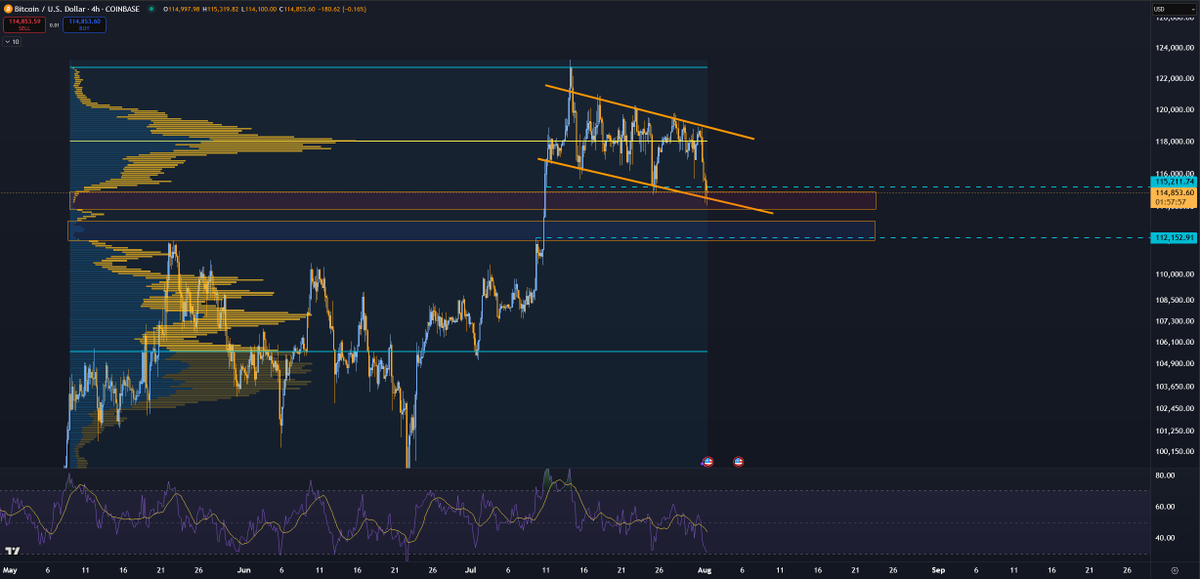
$BTC Update (LTF)
Scenario 2 is almost complete.
- ✂️When I see too much chop within a tiny price range (like we did around 118k) I usually think it's just the middle of a broader range (probably 113k-123k).
- 📉RSI was stuck at 50 even on 4H TF which usually means "don't trust this PA"
- 📊We also have two volume gaps, one around 114k and one around 112k. However, when two levels are too close to one another I always give credit to the first one (first trouble area logic)
- 🎲Game-Theory-wise; After a major upside move the best way to hurt both bulls and bears is chop; Bulls erase their gains by longing every dip or sitting on weak alts, while Bears get comfortable and never switch bias or look for bullish entries.
What now:
- Still HTF bullish
- First half of August is expected to be choppy
- BTC and ETH will be OK, alts are already bleeding
- This is why I've been very persistent on ETH being the Leading Indicator, insisting that it will be extremely difficult for MOST alts to keep up with ETH (and you should chart your alts against ETH)
- If your alts have been weak against ETH during July you'd be better off selling them for ETH until their ETH chart looks better.
- I hope you've read the quoted post (July 14) as well as the ETH levels post (July 22) and took some off the table to maintain your peace of mind or even be able to bid alts if they bleed too much.
- All in all, whether you're bullish or bearish right now, I'd say "look at the OTHERS/ETH chart and bid others when it bottoms out"
Let me know if this helped you clear your mind 😉
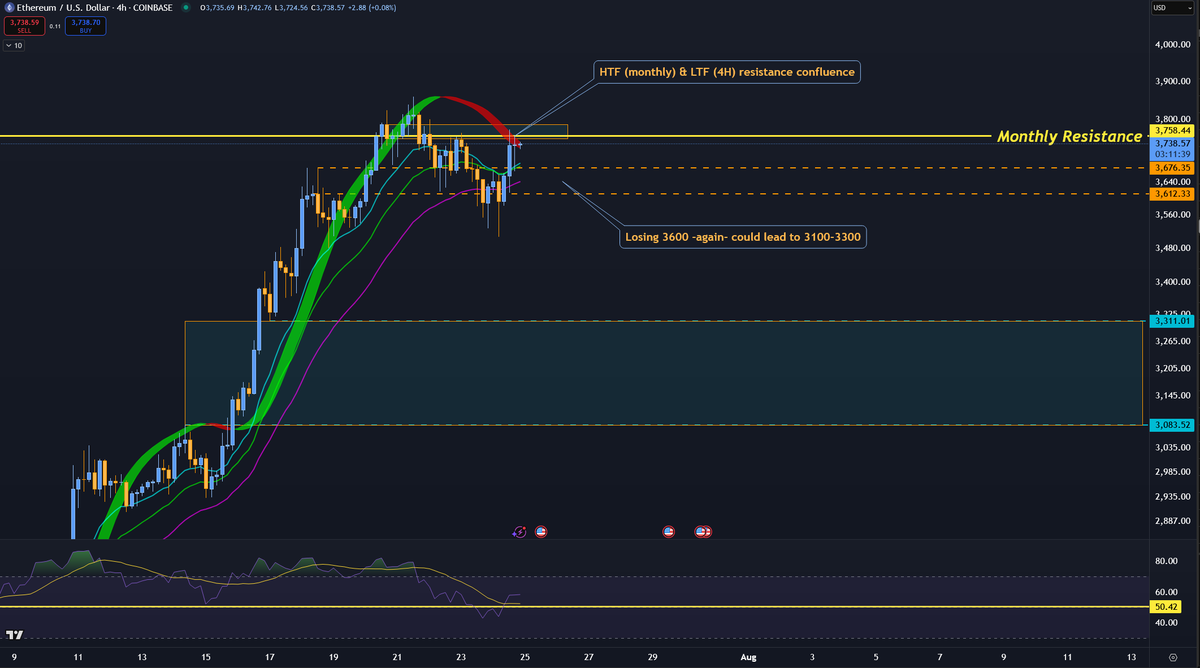
$ETH Some thoughts on LTF
So far, ETH has kept it's 4H EMA + RSI trend intact.
Facing some resistance at 3750 which makes sense, it's monthly resistance.
- If it breaks above 3750 on the 4H and closes above on the daily I'd assume we go for those 4100 highs next.
- Otherwise, losing 3600 -again- could lead to a deeper correction towards 3100-3300 (and trend would still be bullish on the Daily TF)
Overall, still expecting new ATH sooner rather than later.
That said, I've taken some profit on the way up and I intend to continue doing the same as we push higher (check quoted post)
Here's my plan for now.
There are both positive and negative news that can greatly affect my plan, so take it with a grain of salt and use it mostly as food for thought.
War News:
- US involvement, check ✅️
- Bomb nuclear facilities, check ✅️
- Close Hormuz strait, almost a check ☑️
- Hit on US bases, not priced-in, could happen (negative 👎)
- War escalation, not priced-in, could happen (negative 👎)
- Iran leadership capitulation or regime change, not priced-in, could happen (positive 👍)
Macro news:
- 2x FED members open to change of monetary policy and/or rate cuts. Nothing official yet, just comments.
- One BBB Act likely to pass. It includes spending and tax cuts.
TA/Charts:
- Weekly closed below previous Weekly Close ATH (bearish 🐻)
- Daily closed confirming a lower-low in daily structure (bearish 🐻)
- LTF; 98-100 local support. 102.7 local resistance. Below 98 -> 93s-95s. Above 102.7 -> Short Squeeze towards 104.7-106.5
Plan:
- For now, slowly build some spot positions around the lows. Sell the bearish retest at 104.7-106.5.
- If situation is still shitty then expect new lows (93-95), buy them and sell into the next short Squeeze. Repeat until end of summer. It will look something like that; 98->105, 93->101, then a slow reversal.
- If situation resolves positively, then 102.8 should become our new support for a time-based bottom. Once the time-based bottom is in, we'll move towards 112k+
Hope this helps you build some kind of Thesis and Perspective. 🙏
Απόψε στις 9 ώρα Ελλάδας, εδώ: https://t.co/FNQSxvYy2n
σας έχω ετοιμάσει μόνο 40 slides 😅 θα γίνει της κακομοίρας! Όποιος τολμηρός θέλει να μάθει live, το link το έχω στείλει ήδη (όποιοι ενδιαφέρεστε πείτε, θα δούμε πόσοι είμαστε επί τόπου), οι μαθητευόμενοι μάγοι να μπουν κανά πεντάλεπτο-δεκάλεπτο πριν!
Retail doesn’t seem to have capitulated yet.
Here is a few signs:
- When serious deleveraging occurs and margin calls hit, literally any asset gets sold to raise cash and meet these margin calls. Gold is a very institutionalized asset class and on Friday it showed some signs of weakness. Bitcoin is a retail-heavy asset class and it isn’t budging yet.
- Several banks reported that on Thursday retail added a large amount of equities via ETF flows. That’s not what you do when you are deleveraging.
- To my knowledge, massive contra indicators like CNBC going live with a special “Markets in Turmoil” episode or Brent Donnelly’s proven front-page contrarian covers haven’t happened yet
More importantly, the buy-the-dip mentality will need a few more hits before cracking.
Even after this drawdown the S&P 500 is still up 119% over the last 7 years, which is a massive compounded yearly rate well in excess of the standard 7-8% investors are used to in normal times. Recent surveys show investors growing accustomed with the fairytale assumption of a 10% yearly SPX return.
If the drawdown extends to levels challenging these assumptions and threatening the excess wealth accumulation of 2019-2024, I expect retail to start deleveraging.
Funnily enough, that might happen at the worst possible time and compound economic weakness through reduced consumer spending.
Retail capitulation hasn’t happened yet, and that’s not a good thing.
Tomorrow at 8 PM EET on YouTube, I’m teaming up with @DegenClubGR to break down today’s FOMC moves and dive into his system for decoding the market outlook. Join us! 👇 [🇬🇷 stream]
https://t.co/9261BMM60n
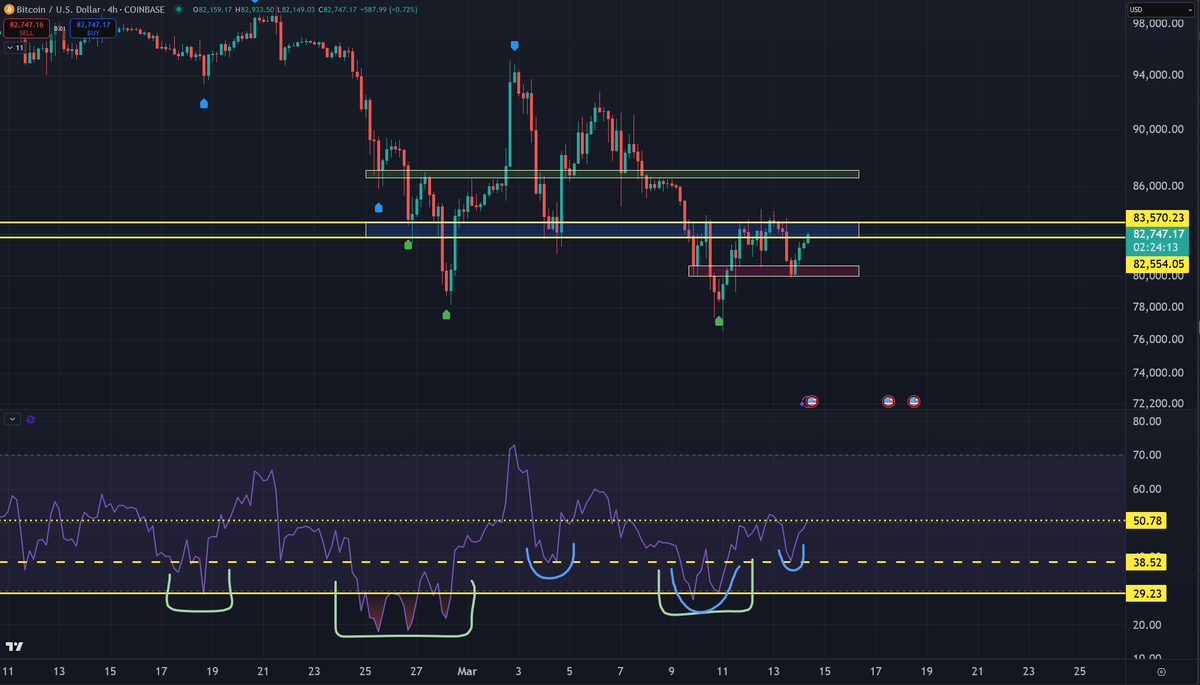
$BTC
Break through blue --> Go above green
Get rejected at blue --> Go below red
Also, check RSI;
Green fractal repeats itself on a smaller scale in the form of blue fractal (support -> deviation -> reclaim)
If there's any fuel in the tank for a reversal/relief, now is the time.