$LTC Is Setting Up For A MASSIVE Move That Could Shock The Entire Market.
#LTC At $42 Right Now. Down Bad. Left For Dead. Nobody Cares.
Perfect. That's Exactly How Every Major Litecoin Rally Started.
Look At The 3W Chart:
2018-2020: Price Accumulated At The Bottom For 2 Years While Everyone Called It Dead.
Then It Rallied 1,622%. From $24 To $413.
Fast Forward To 2025-2026:
✅ Support Line Broken → Liquidity Grab?
✅ New Accumulation Zone Forming At $40-$30
✅ Same Structure As 2018-2020
✅ Currently Down ~91% from ATH ( Discount Zone )
If Fractal Repeats (TARGETS): $150 → $250 → $400 → NEW ATH $800+
Potential Upside: 2100%
The Most Hated Coins In Bear Markets Become The Most Loved In Bull Markets.
@litecoin Is The Most Ignored Chart In Crypto Right Now. And That's Exactly Why I'm Watching It.
Bookmark This. 🚀
@SatoshiLite
$MSFT Called this 350/360 zone a few days ago.
Said big players will have eyes on this level.Look what happened. Tapped it and bounced. Exactly how multi-year support works.This is why we study the higher time frame chart. Levels that held in 2021, 2023, and 2025 don't just disappear. Big money knows where to step in. Your job is to find the level before price gets there
$BTC Plunges 54% in 8 Months, Wiping Out ~$1.30 Trillion
The sharp decline has erased more than half of Bitcoin’s market value, marking one of the largest drawdowns in its history and testing investor conviction.
🚨Many posts on FinX are currently calling $MSFT a generational buy.
However, the daily chart shows what appears to be a classic Head & Shoulders top pattern:
- Clear Left Shoulder → higher Head → Right Shoulder structure
- The Head is distinctly higher than both shoulders
- A well-defined neckline (a slight slope is acceptable)
- The Right Shoulder looks complete and formed near the 200 SMA, showing what appears to be an island reversal (despite rising volume)
The formation is not yet confirmed. I would prefer to see a solid weekly close below the neckline before considering it triggered.
If and when a decisive break occurs, it would shift the technical bias toward more bearish price action, with a measured target near the $300 zone.
Nevertheless, a disciplined investor should not turn bullish on this chart until price recaptures the $466 level.
Patterns can morph or fail. A failed pattern would be a close above $466. This would represent the real bullish confirmation on the higher timeframe.
My plan is to wait and see whether this H&S pattern plays out or invalidates.
What are your thoughts? Drop your comments below
👇
Has the bottom been confirmed? Absolutely not. $BTC
At present, there is still insufficient evidence to speak of a definitive low. The market may have found a support level, but until technical confirmation and a change in structure materialise, it would be premature to declare a bottom.
That said, for those thinking like long-term investors rather than traders, the $60,000 level may represent a good point to start gradually building up a position.
The concept is simple: don’t try to guess the perfect low, but build up a position over time using DCA (Dollar Cost Averaging). If the market were to continue falling, you would increase your exposure at levels such as $52,000 and $42,000, thereby lowering your average cost basis.
The aim, however, is not to make a quick trade or chase a short-term rebound. The idea is to maintain a long-term perspective, aiming to profit only at much higher levels – for example, above $150,000 – should the market enter a new bull cycle.
I would like to reiterate a fundamental concept: this is not trading, it is investing. They are two completely different approaches. The trader looks for confirmation, manages risk and focuses on short- and medium-term movements. The investor, on the other hand, accumulates assets methodically, accepts volatility and thinks in terms of years, not weeks. The difference between the two approaches is what often determines long-term success.
I’ve never seen this many “crypto is over” posts in my life.
Everyone forgot about 4 year cycles - which only makes me more confident that cycles still work.
Just buy BTC in Sep-Oct at $40k and hold it for 3 years until $240k+.
It’s really that simple.
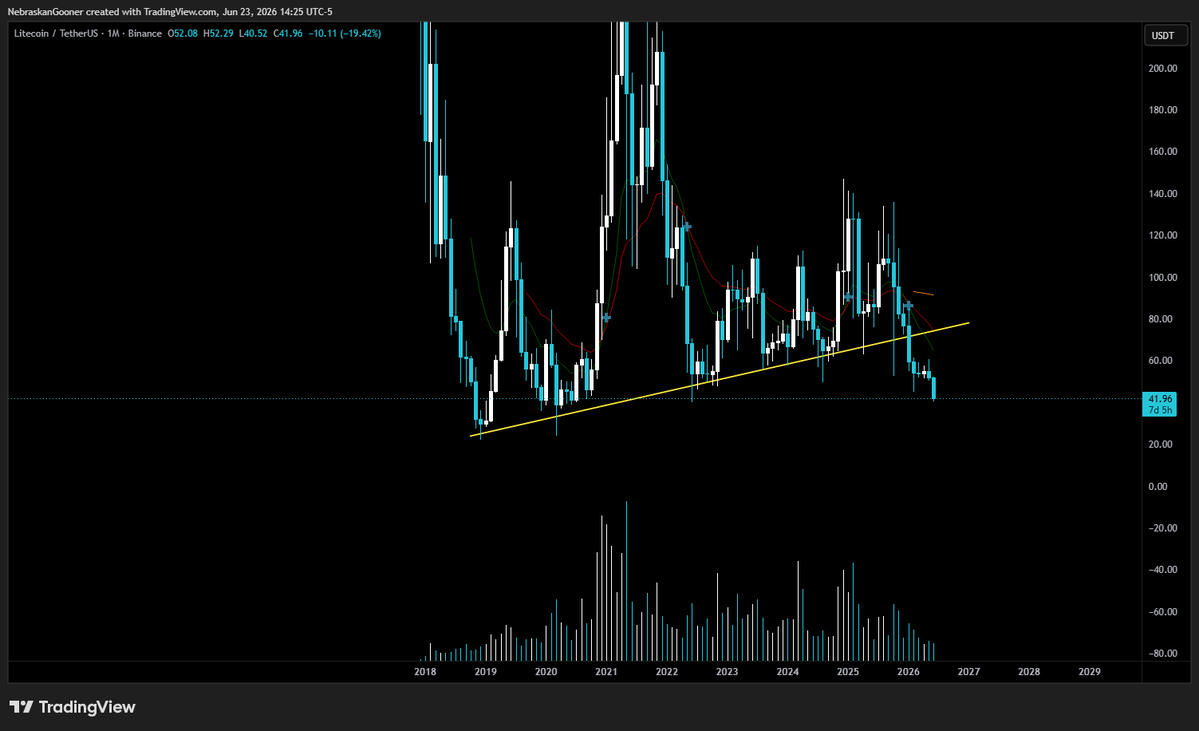
$LTC
Continues to nuke after losing this major historical trendline.
Probably back to sub-$35 at a minimum. Hard to trust it until it shows us something positive.
$PLTR will decline by -50% again
And if you don't believe me, look at what happened in Feb, when it declined by -48% in 2 months....when the market declined by -28%
Except now it is lot more exposed.
Lionel Messi is the best attacking football player to ever play the game.
Unreal what he's done his whole career
Unreal what he continues to do at his age
He is not human 🐐