@posit_glimpse Can you please do a post on updating BigQuery via Tidyverse, as existing articles/tutorials cover access and manipulate but not the update part
Using R and BigQuery, or specifically tidyverse to overcome my humble SQL. Works great but struggling to update BigQuery. I run into mismatch of data type errors, especially the timestamp ... I can dig up and share the exact error @posit_glimpse -
𝗛𝗼𝘄 𝗚𝗜𝗧 𝗪𝗼𝗿𝗸𝘀
Git is a distributed version control tool that facilitates the monitoring of changes made to your code over time. Git makes it simple to track changes to your codebase and collaborate on projects with others. It was authored by Linus Torvalds in 2005 for the development of the 𝗟𝗶𝗻𝘂𝘅 𝗸𝗲𝗿𝗻𝗲𝗹, with other kernel developers contributing to its initial development.
It enables us to 𝘁𝗿𝗮𝗰𝗸 𝗰𝗵𝗮𝗻𝗴𝗲𝘀 𝗶𝗻 𝗼𝘂𝗿 𝗰𝗼𝗱𝗲 𝗮𝗻𝗱 𝗰𝗼𝗹𝗹𝗮𝗯𝗼𝗿𝗮𝘁𝗲 𝘄𝗶𝘁𝗵 𝗼𝘁𝗵𝗲𝗿𝘀, by working on a different part of a codebase independently. When we say distributed, we may think that we have code on two locations, remote server and locally, but the story is a bit more complex than that.
Git has three storages locally: a Working directory, Staging Area, and a Local repository.
𝟭. 𝗪𝗼𝗿𝗸𝗶𝗻𝗴 𝗗𝗶𝗿𝗲𝗰𝘁𝗼𝗿𝘆 - This is the area where are you working and your files live (also called "untracked"). All file changes here will be marked and if not saved to GIT, you will lose them. The reason is that GIT is not aware of those files.
𝟮. 𝗦𝘁𝗮𝗴𝗶𝗻𝗴 𝗔𝗿𝗲𝗮 - When you save your changes with git add, GIT will start tracking and saving your changes with files. These changes are stored in the .git directory. Then, files are moved from Working Directory to Staging Area. Still, if you make changes to these files, GIT will not know about them, you need to tell GIT to notice those changes.
𝟯. 𝗟𝗼𝗰𝗮𝗹 𝗥𝗲𝗽𝗼𝘀𝗶𝘁𝗼𝗿𝘆 - It is the area where everything is saved (commits) in the .git directory. When you want to move your files from Staging Area to Local Repository, you can use the git commit command. After this, your Staging area will be empty. If you want to see what is in the Local repository, try git log.
Some basic 𝗚𝗜𝗧 𝗰𝗼𝗺𝗺𝗮𝗻𝗱𝘀 are:
🔹 𝗴𝗶𝘁 𝗶𝗻𝗶𝘁 -> Create a new git repo in the directory
🔹 𝗴𝗶𝘁 𝗯𝗿𝗮𝗻𝗰𝗵 -> Create a new local branch
🔹 𝗴𝗶𝘁 𝗰𝗵𝗲𝗰𝗸𝗼𝘂𝘁 -> Switch branches
🔹 𝗴𝗶𝘁 𝗮𝗱𝗱 -> Add a new file to your staging area
🔹 𝗴𝗶𝘁 𝗰𝗼𝗺𝗺𝗶𝘁 -> Adds staged changes to your local repository
🔹 𝗴𝗶𝘁 𝗽𝘂𝗹𝗹 -> pull code from your remote repo to your local directory
🔹 𝗴𝗶𝘁 𝗽𝘂𝘀𝗵 -> Push local repository changes to your remote repo
🔹 𝗴𝗶𝘁 𝘀𝘁𝗮𝘁𝘂𝘀 -> Show which files are being tracked (and untracked)
🔹 𝗴𝗶𝘁 𝗱𝗶𝗳𝗳 -> See the actual difference in code between your Working Directory and your Staging Area
Along with GIT commands, you can try and use some popular 𝗚𝗜𝗧 𝘁𝗼𝗼𝗹𝘀: GitHub Desktop, SourceTree, TortoiseGit, Git Extensions, GitKraken, SmartGit, Tower, etc.
#softwareengineering #programming #developers #coding #git
🌟Day 20 - We're just trying to find a model that best describes the data🌟
Same made-up data on each plot:
A univariable
B, C multivariable
Note the R-squared 😉
#HealthyR#rstats "R for Health Data Science"📖 chapter:
https://t.co/bTtHk2WUVZ
The Loyalty Paradox - How a change of direction in its data journey helped @WyndhamHotels strengthen trust with and preserve value for its most loyal customers
https://t.co/tEiWvLh6yM
#CustomerExperience@PwC
Pretty big #rstats announcement from @Rstudio - the `text` package brings the ability to use cutting-edge language models (BERT, RoBERTa, and GP) to the R universe. https://t.co/Vgqa2yW9Jt
Currently updating the "distance" poster...
https://t.co/oqcgNkpQjU
Which distance/connection should I add and still remain readibility?
Done: Wasserstein, IPMs, MMDs, ...
FSDL Lecture 6: Deployment is now live!
This lecture covers a critical step: getting your model into prod.
The key message is similar to our philosophy in other parts of the ML workflow:
Start simple, add complexity as you need it.
https://t.co/nqpBBzjiuW
Frighteningly powerful #rstats combo:
mutate() + across() + {tidyselect} helpers 💥 🤯
The syntax may be a bit confusing at first, though. So, here are a couple of simple examples.
CODE: https://t.co/F7Ix3vpynS
Here are all of the rivers and waterways in South America, with coastlines, coloured according to the major hydrological basins they are part of and scaled by their size.
This map was generated using #Matplotlib. #DataVisualization#Python#DataScience#Data#SouthAmerica
I'm behind on twitter, but I'm happy to say that the recording of my #RStudioconf talk "tidyclust - expanding tidymodels to clustering" is now available https://t.co/SmLW4nxssJ
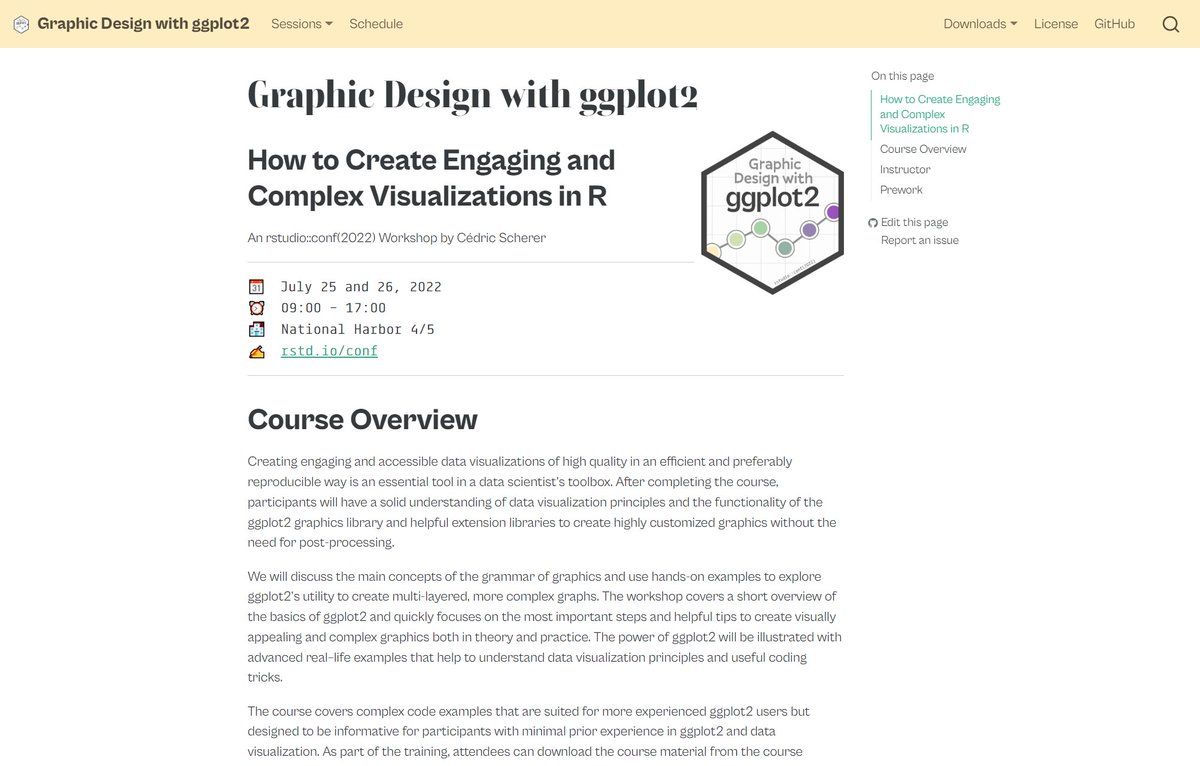
"Graphic Design with #ggplot2" 👨💼👩💻🧑💻
Do you want to recap the 2-day workshop at #rstudioconf? Or do you feel sad you've missed it?
🔥 All course material incl. latest updates can be found on the workshop webpage—9 sessions, 760 slides, 314 ggplots!
👉 https://t.co/TyBRWQOW7R
Publishing new packages live from #rstudioconf2022 😜. Introducing {constructive}! prints code that can be used to recreate R objects, like a pretty `dput()` using idiomatic constructors.
Open to feedback and feature requests!
https://t.co/1AEnjhQPAf
#rstats
Tired of setting @matplotlib label sizes, not being able to modify your figure texts in Adobe Illustrator, and having to change your figure fonts to match the one of your tex document? Give LovelyPlots a try! https://t.co/0UNMke29g5