$PINS claims 105M MAUs in NA. US and Canada population equals 340M+40M. Strip out the really young and really old unlikely users and maybe get to 300M total TAM. That’s 1 in 3. I don’t know anyone that uses Pinterest.
70% skew to women so maybe 1 in 2 women and 1 in 4 men.
600M global users, of which 350M are ROW. 60% of users for 7.2% revenue contribution.
Who is using this app as an MAU and how many “pages” are they consuming per session? There’s no messaging feature so you won’t get the daily user high frequency use that you’d see on $SNAP.
The advertising outcomes must be magical to even generate that type of revenue.
SBC of 800M not a good look. Strip mining the company.
Buy what you know and buy what you use. Who is using this site/app?
How big should a autonomous vehicle ridesharing fleet actually be?
Peak demand? Average demand? Somewhere in between?
I built a city-level AV fleet optimizer to answer this, and the result is unintuitive but consistent across markets:
https://t.co/YuK4kUnMl3
The profit-maximizing fleet size is just shy of peak demand. The core tradeoff in autonomous ridesharing isn’t technology, it’s pricing vs utilization, and the relationship is deeply non-linear.
At small fleet sizes, adding vehicles captures unmet demand and improves utilization. But once a fleet approaches full demand coverage, incremental vehicles stop creating new trips. They simply spread demand across more idle assets.
What looks like “better service” quickly turns into self-inflicted price compression.
This problem is worse for AVs than for human drivers. Humans naturally exit the market when prices fall. AV fleets don’t. Oversupply persists, and price becomes the only clearing mechanism.
Across major US MSAs, the model converges on the same answer:
• Optimal demand coverage: ~98–99%
• National Top-20 MSAs: ~319k vehicles
• Not millions
• Not sized to full peak
The last 1–2% of demand coverage destroys pricing power faster than it increases utilization.
The economic optimum sits where nearly all demand is served, but scarcity still exists often enough to preserve price discipline with charging, cleaning, and downtime pushed into off-peak hours.
❌ Maximizing utilization is the wrong objective.
✅ Maximizing fleet-level profit is the right one.
$UBER $TSLA $GOOGL $LYFT
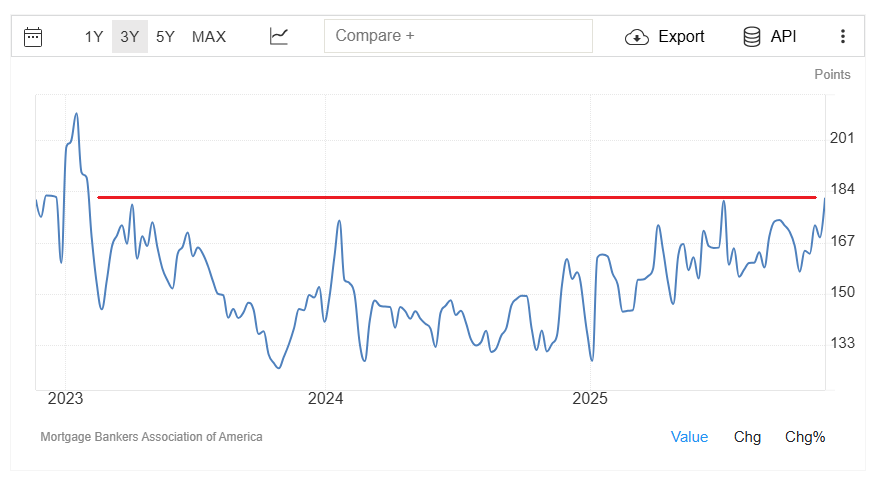
Mortgage applications jumped 28.5% from one week earlier, according to the Mortgage Bankers Association (MBA) Survey for the week ending Jan. 9.
“Mortgage rates dropped lower last week following the announcement of increased MBS purchases by the GSEs,” said Joel Kan, deputy chief economist at the MBA.
The average contract interest rate for 30-year fixed-rate mortgages with conforming loan balances ($832,750 or less) declined to 6.18% from 6.25%, the MBA said.
“Compared to a holiday adjusted week refinance applications surged 40% to the strongest weekly pace since October 2025,” Kan said.
For more: https://t.co/Lu25VtTYob
$GRAB - profitable, dominant market share in rides and food delivery in all 8 SEA markets. $20B mcap, 7B cash, 2B long term debt. $15B EV. Go long and stay very long on this one. Throwing up good numbers one Q at a time. $5/share. Price of a Costco 🐓
https://t.co/VKOk6H1i2w
My 2026 Top 5 Picks have defense & offense:
$CSCO “Keep Riding the AI wave”– corporate upgrade cycle
$BA “I love big backlogs I cannot lie” & ramping cash flow
$NKE “Just Do It”-Turnaround w/ depressed multiple & EPS
$AAPL “Better Late than Never”- AI enabled foldable iPhone
$PI “The time has come”- RFID tech at an inflection point
I will put out a more detailed write-up on each name this Sunday as well as the overall positive and negatives I see for the market as a whole. I wanted to keep this post shorter given my @CNBC interview on New Year’s Eve with @davidfaber and @saraeisen got into each name in a bit more detail.
These picks are for investors that cannot short stocks to manage risk, do not have access to the same hedging tools available to me or do not have time to manage a portfolio full-time as I do. These are my best ideas right now for an investor that wants to buy a basket of stocks and not trade it for the rest of the year. The goal is to not update this list unless I think I have really gotten the thesis drastically wrong on a name. Past performance is not indicative of future results.
To be clear, for my own investments, position sizes of all names including my Top 5 Picks below are constantly being adjusted depending on my view of the future risk adjusted returns. I also have many more positions than just my 2026 Top 5 Picks.
While these are my best five ideas for 2026 based on the information I have today, my thoughts are constantly evolving based on new information & the reaction of the stock market to that data. In addition, a good hit ratio is 60% so I would expect three of the names to outperform while two are likely to under-perform. Hopefully in aggregate the results will not only be better but less volatile than the overall market. This was certainly helpful in March/April of 2025. Sleeping well at night is worth something.
As always, the key will be to remain intellectually flexible and data dependent. As Charles Darwin said, "It is not the strongest of the species that survives, nor the most intelligent, but the one most adaptable to change."
Happy New Year and I wish you all a prosperous 2026.
What’s more interesting: why is it that so many in the 40-80% are not taking the test? The lazy answer is always to say the rich have test prep. Certainly someone in the 50%tile can afford prep if that’s the hurdle. There’s free test prep everywhere with web and Khan Academy. How about no prep? Many just too lazy and don’t want to put in any prep. Plenty of prep for all other activities like club ball and travel ball. But now time or money for test prep. Or just a convenient excuse. This is a question for the 40-80%tile.
@amitisinvesting@grok .01 because they split 50/50 on .02 with Kalshi. Once Robinhood takes ownership of the prediction markets they will keep .02. Assumes pricing stays the same.
As the director of admissions at USC said from a tour I attend last month: “We are still test optional. That means that if you’re proud of your SAT or ACT score, then you’re more than welcome to submit them.”
We know what the inverse of that is now don’t we?
Bloated GPAs and “holistic” review perpetuate the scam in admissions.
Universities should really show not just the inbound stats, but let’s see the outbound stats. What are the graduation stats of the test optional and equity admits.
The UCs have this amazing junior transfer program. Why is it that there are so many seats open for 3rd year transfers. Why wait til year 3 to take the transfers. Likely because so many unprepared students drop out in year 1 and 2.