🇺🇸 Equities
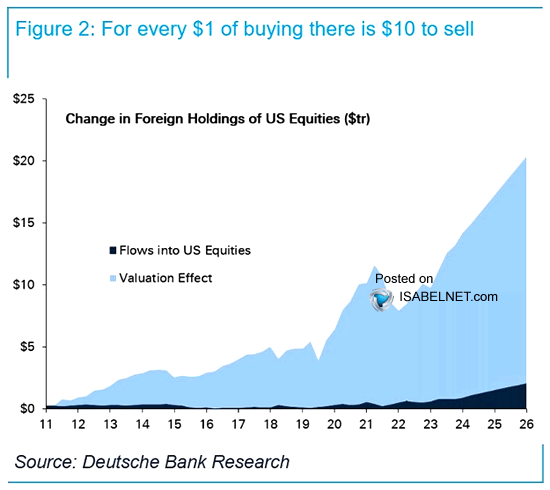
Foreign investors now hold roughly $10 in US equities for every $1 they have bought. The buying that built the position was modest. The position itself is not. If sentiment turns, that imbalance could matter
👉 https://t.co/blMxcoFA78
@DeutscheBank $spx #spx#stocks
Top 15 S&P 500 Companies by Return on Equity (ROE).
▪︎ Mettler-Toledo $MTD leads with a 2,161% ROE. $DELL follows at 1,448% ROE, $GDDY taking 3rd at 837%.
▪︎ $APP leads profitability with a 66% net margin, followed by $MA at 47%.
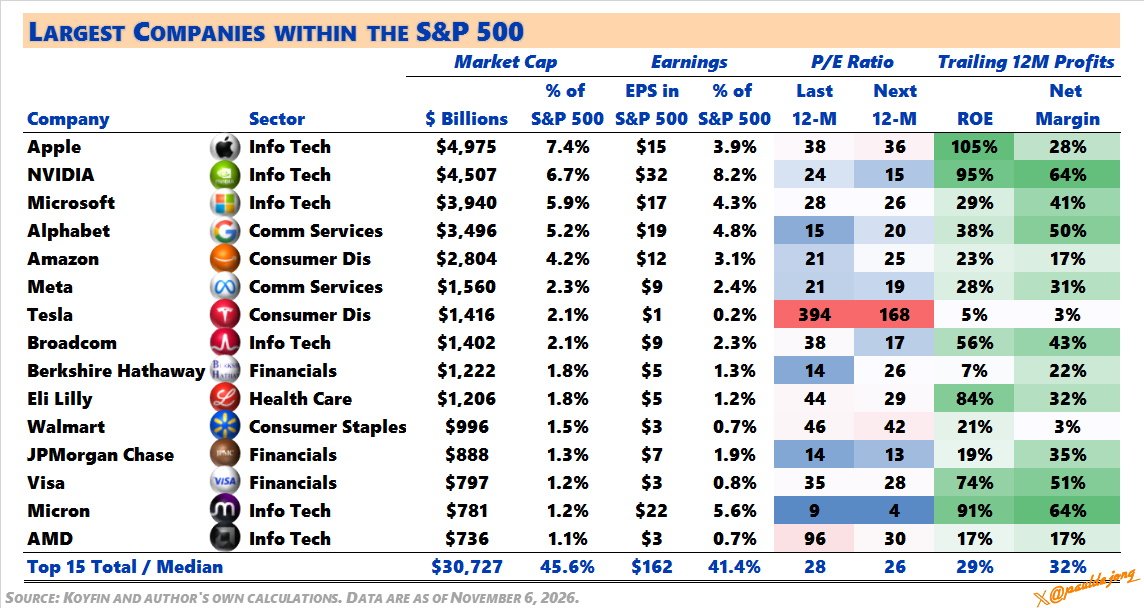
The top 15 companies in the S&P 500 now represent 45.6% of the index's total market cap and 41.4% of all earnings.
$NVDA and $MU have massive 64% net profit margins. $AAPL leads the board on ROE with 105%.
Valuations range from Micron's 9x P/E all the way up to $TSLA 394x.
@jbfinancebull Top 10 companies in the MSCI Emerging Markets account for 41% of the total market cap (heavily weighted toward megacap tech like Samsung, SK hynix & $TSM).
The top 15 companies in the S&P 500 now represent 45.6% of the index's total market cap and 41.4% of all earnings.
$NVDA and $MU have massive 64% net profit margins. $AAPL leads the board on ROE with 105%.
Valuations range from Micron's 9x P/E all the way up to $TSLA 394x.
Today's Chart of the Day was shared by @JC_ParetsX
The Nasdaq is reclaiming a key support level after a brief break below it, and if the failed breakdown holds, the snapback could be just as sharp as the selloff.
Get the full details in today's report plus more great charts. ⬇️
https://t.co/gbarfp8LPv
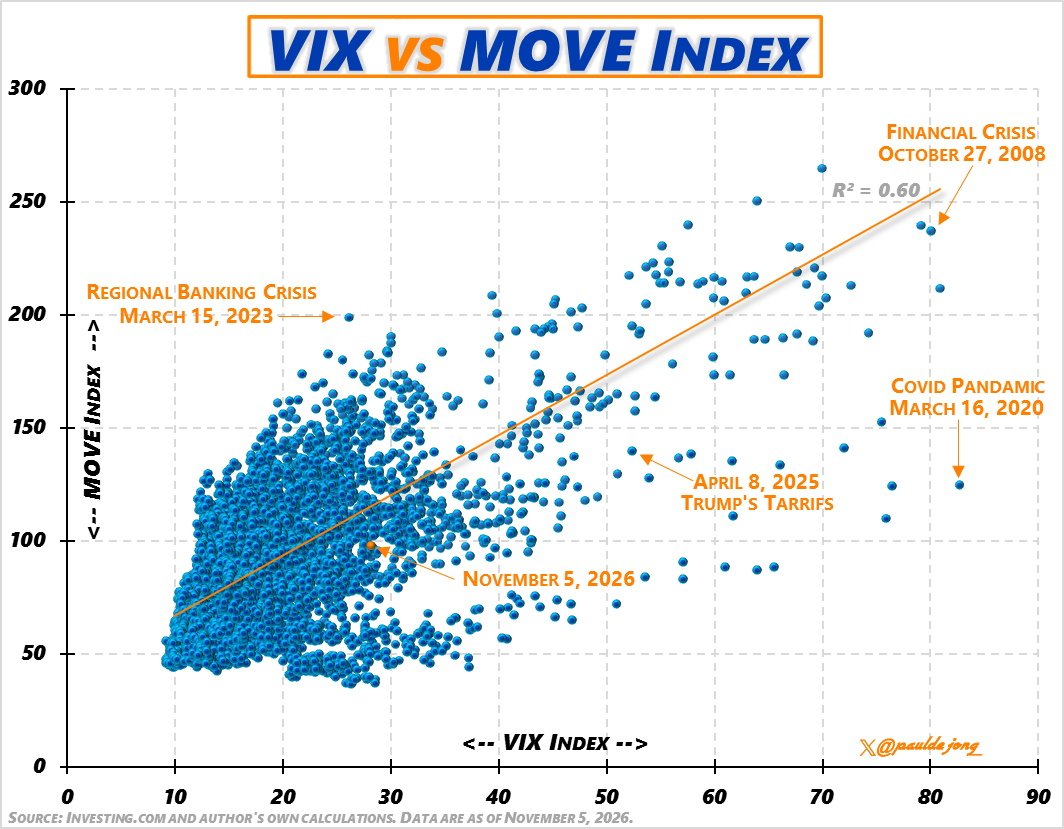
VIX (Equity Vol) vs MOVE (Treasury Vol).
While they usually move together different shocks hit different asset classes:
▪︎ Banking/Rate shocks (like March 2023) shake the bond market harder.
▪︎ Exogenous panics (like March 2020) hit stock market sentiment hardest.
▪︎ True systemic crises (like 2008) set off alarm bells in both.
As of November 2026, both indices show relatively muted levels compared to historical panic points.
VIX (Equity Vol) vs MOVE (Treasury Vol).
While they usually move together different shocks hit different asset classes:
▪︎ Banking/Rate shocks (like March 2023) shake the bond market harder.
▪︎ Exogenous panics (like March 2020) hit stock market sentiment hardest.
▪︎ True systemic crises (like 2008) set off alarm bells in both.
As of November 2026, both indices show relatively muted levels compared to historical panic points.
Today's Chart of the Day was shared by @sstrazza
Semiconductors relative to the S&P 500 have broken down from a multi-month top as their 5-week rate of change plunged to -26.5%, a sequence eerily similar to what we saw in 2000 when the dot-com bubble burst.
Get the full details in today's report plus more great charts. ⬇️
https://t.co/YHfOMDnKD0
The stocks ranked 16th to 30th in the S&P 500 make up 9.8% of the market cap & 9.9% of EPS
🔹 $PLTR and $MA are keeping nearly half of every dollar they generate as profit (50% and 47%)
🔹 $BAC trades at the lowest valuation with a forward P/E of 10
🔹 $ABBV leads the group with a 393% ROE
The stocks ranked 16th to 30th in the S&P 500 make up 9.8% of the market cap & 9.9% of EPS
🔹 $PLTR and $MA are keeping nearly half of every dollar they generate as profit (50% and 47%)
🔹 $BAC trades at the lowest valuation with a forward P/E of 10
🔹 $ABBV leads the group with a 393% ROE
The S&P 500 top 15 stocks account for 45.4% of market cap and 41.3% of earnings.
🔹 Top 3: $AAPL ($4.9T), $NVDA ($4.9T), $MSFT ($3.8T)
🔹 Highest ROE: Apple at 121%
🔹 Highest Profit Margin: NVIDIA & $MU at 64%
🔹 Widest P/E Gap: Micron (11x) vs. $TSLA (444x)
The S&P 500 top 15 stocks account for 45.4% of market cap and 41.3% of earnings.
🔹 Top 3: $AAPL ($4.9T), $NVDA ($4.9T), $MSFT ($3.8T)
🔹 Highest ROE: Apple at 121%
🔹 Highest Profit Margin: NVIDIA & $MU at 64%
🔹 Widest P/E Gap: Micron (11x) vs. $TSLA (444x)
The S&P 500 top 15 stocks account for 45.4% of market cap and 41.3% of earnings.
🔹 Top 3: $AAPL ($4.9T), $NVDA ($4.9T), $MSFT ($3.8T)
🔹 Highest ROE: Apple at 121%
🔹 Highest Profit Margin: NVIDIA & $MU at 64%
🔹 Widest P/E Gap: Micron (11x) vs. $TSLA (444x)