Is Europe falling behind the US on productivity? The Krugman vs Aghion–Bergeaud–Garicano debate hinges on one choice: current vs constant PPPs. A new note maps the gap behind it — all 27 EU states, two data sources — and what it does and doesn't settle. 🧵
@e_u_eco The HC index does not have a base year, it is defined as e^(phi(S)), where phi is the (assumed) rate of return on schooling and S is the average years, see https://t.co/icB3IIalvp for details
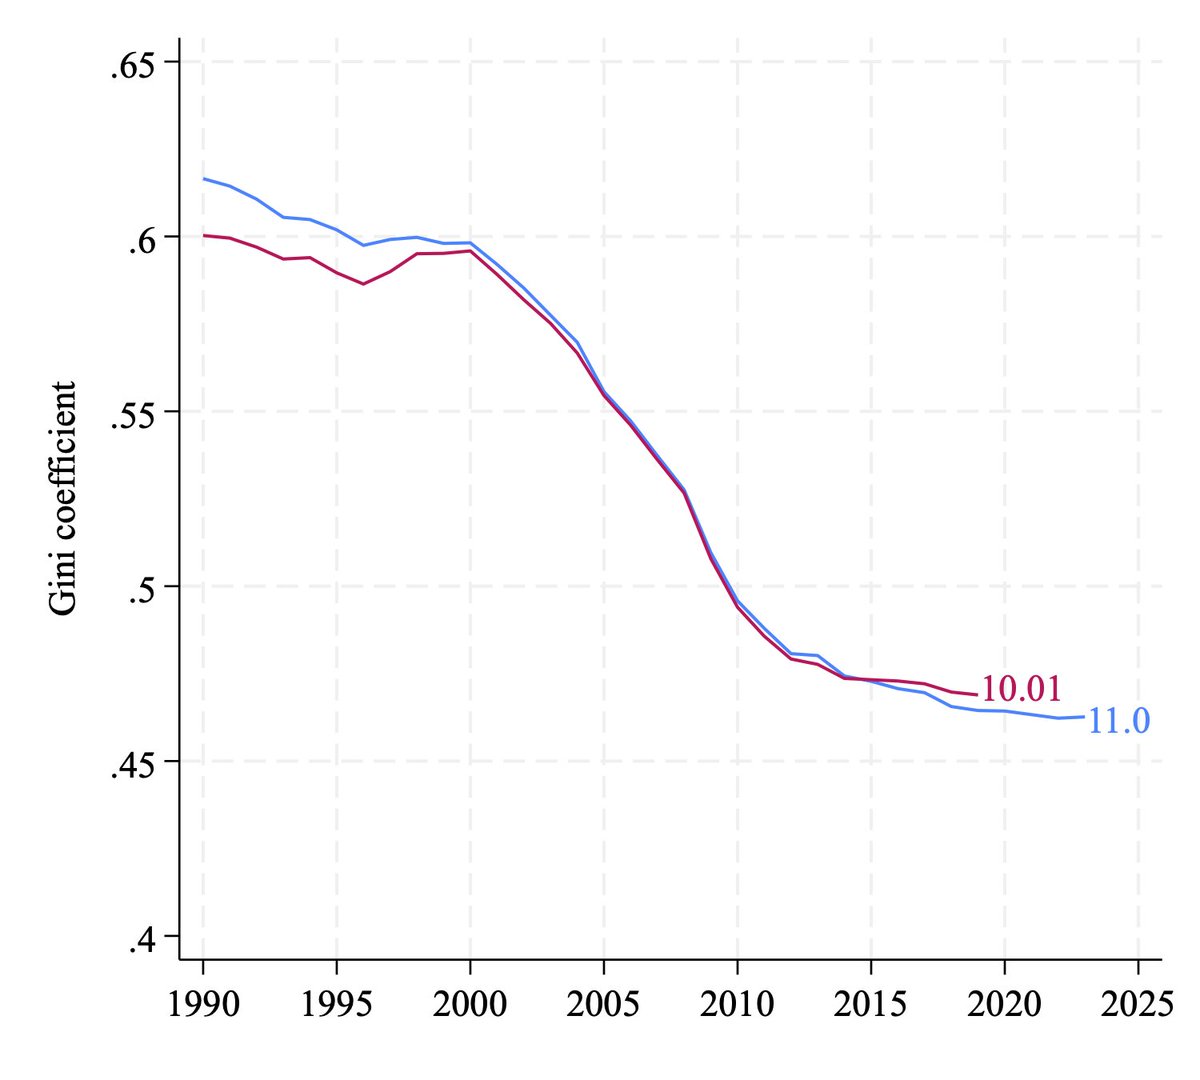
Version 11.0 of the Penn World Table has just been released. You can download the data and documentation here: https://t.co/2T2sxt5ISX. This new version covers 185 countries and the period 1950-2023
FRED now includes data from @PennWorldTable version 11.0. Read our latest FRED Blog post for insights on this academic collection of international economics data https://t.co/XLrDv7pTHU
Some recent new discussions about total factor productivity (TFP) numbers in @PennWorldTable, with the notably reductive post by @Noahpinion as a low point: https://t.co/rmqdQepEHN (1/)
📊 Data update: The @PennWorldTable is an extensive database that helps us understand long-run, global trends in economic growth, working hours, productivity, and living standards.
We’ve updated 17 of our charts using the latest release.
This data gives us a clearer picture of how countries compare today, and helps us understand how technology, innovation, and better use of resources have shaped economies and living standards over the last 70+ years.
The Penn World Table is maintained by researchers at the University of Groningen and the University of California, Davis. This year they celebrate their 50th anniversary!
This update was led by @parriagadap and @BerthaRohenkohl.
On October 7, 8 and 9, Robert Feenstra, Robert Inklaar and Chad Jones will give lectures in the IEA Lecture Series on the 50th Anniversary of PWT. Robert Inklaar's will include a preview of PWT 11 numbers. For more info and registration, see: https://t.co/qtA68wpyW2
This new version includes new data from ICP (https://t.co/MRba55E7Qd), through 2021 and new National Accounts data, through 2023. Most notable change in terms of data construction is that our (default) data for China are the official series
We can continue to track international income inequality with these new data and at tomorrow's IEA lecture (https://t.co/qtA68wpyW2), Robert Inklaar will discuss more results from PWT 11.0
It is with deep sadness that we announce the passing of Alan Heston, Professor Emeritus of Economics at the University of Pennsylvania and one of the original architects of the Penn World Table. We honour his memory here: https://t.co/xrONayHcoL
@DrDavidMFrankel Hi David, we are working on version 11. Amongst other things, we still await the researcher data file for ICP 2021, we need to update additional data and give you users a good sense of what is changing. I hope we can be clearer on an ETA soon, but it will be months.
@juanjung Hi, it's on our agenda. The release of ICP 2021 (due in the next month or two) is a key input. Beyond that, it depends on how fast the work progresses. "Not within the next 6 months" is my best answer right now. ^RI
What sectors make lower-income countries so unproductive? Answering this question needs good new data and a fresh view on which sectors are tradable. A 🧵 thread on a new database and paper (https://t.co/cN16yi19n7) (1/8)
Our colleagues at the University of Queensland have released a new version of their database on comparative income levels: https://t.co/QeeQs25zHg. Compared to PWT, this database has much information on within-country inequality and uses another approach to income comparisons.
No additional years or other basic data have been added with 10.01. We expect to proivde a new version after the World Bank's ICP 2021 purchasing power parity data are released in approximately one year's time.
We have released a minor update of the Penn World Table, version 10.01, see https://t.co/2T2sxt5ISX. This update changes part of the calculation of investment prices and most notably impact capital growth.
Details of this change can be found here: https://t.co/kfdfA2hW7o, which also includes a discussion of the quantitative impact on the most-affected variables.