Our World in Data is a free, nonprofit website with a mission to increase understanding of the world’s largest problems and drive informed action to solve them.
What do death certificates tell us about what people die from?
When someone dies, a doctor or an official records the cause on a death certificate. Countries add up these records and send the totals to the World Health Organization (WHO), which publishes them in its Mortality Database.
We recently brought the latest data release to our site. It covers 25 types of cancer, such as stomach cancer, and broad groups of causes, such as cardiovascular diseases. It also has data on suicides and homicides, and feeds 72 of our charts.
The map shows which type of cancer has the highest death rate among women in each country. Breast cancer comes first in 59 of the 91 countries and territories with recent data, and lung cancer in 23, including the United States, the United Kingdom, and Canada. On the same map for men, lung cancer comes first in 58 countries.
The map only shows data for a handful of countries in Africa and South Asia. Most of the others have no data because many deaths there are never officially registered, or are registered without a doctor certifying the cause. The WHO only shows the years in which at least 65% of a country’s deaths were registered with a cause.
(This data update was led by @lucasrodesg.)
Read our article on antiretroviral therapy and the millions of lives it has saved: https://t.co/ajFpwHJkr7
Other sources & data:
https://t.co/vIgzrKUKdg
At the peak of the HIV epidemic, AIDS caused more than half of all deaths in some countries.
The HIV epidemic — which started in the early 1980s and progressed rapidly in the 1990s — has had lasting impacts that continue today. More than 800,000 people still die from HIV/AIDS every year.
But some countries were hit much harder than others.
In the chart, you can see the share of all deaths in a given year caused by HIV/AIDS in four countries that were particularly badly affected.
At the height of the epidemic, more than half of all deaths in Zimbabwe and Botswana, and over 40% in South Africa and Namibia, were caused by the disease.
Thankfully, interventions to prevent the spread of HIV and treatments such as antiretroviral therapy have reduced death rates across the world. But about one in five deaths in these countries was still caused by AIDS in 2023.
(written by @_HannahRitchie and @parriagadap)
📝 New article on Our World in Data: When do people experience mental health conditions for the first time?
Mental health conditions can begin at almost any age. For many people, they develop in the early stages of life.
Around two-thirds of people who will ever experience a mental health disorder do so by the age of 25.
But this varies a lot by condition.
Some — and in fact the most common mental health disorders — can develop at any point in someone’s life. This includes mood disorders, such as depression and bipolar disorder.
Several are more likely to develop earlier in life, with a very strong peak around adolescence. These include social anxiety, obsessive-compulsive, and eating disorders. Social anxiety, for example, tends to first develop in childhood, and almost 80% of those who will experience it at some point in their lives do so before the age of 18.
Finally, some tend to peak around age 20, but will often still develop later in adulthood. This includes substance use (alcohol and cannabis) disorders and schizophrenia, which commonly develop in someone’s twenties.
Knowing the age at which people might be particularly vulnerable to the onset of a mental health condition is important. It helps societies offer support at the right time to make a difference.
In this article, we look at data on the age of onset of various mental health conditions based on a large meta-analysis of 192 studies.
Explore more data on religious affiliation, practices, and changes over time in our topic page: https://t.co/Fb4hVh8f9y
Other sources & data:
https://t.co/yq7yVHiwi9
https://t.co/iJJQuN7TsR
https://t.co/wdNJvgml8Q
How many people in the world identify with a particular religion?
Religious compositions vary a lot from country to country.
In the United Kingdom, Christianity is the most popular, and following no religion is becoming increasingly common, particularly among young people. But it can be hard to get a sense of how these differences stack up globally.
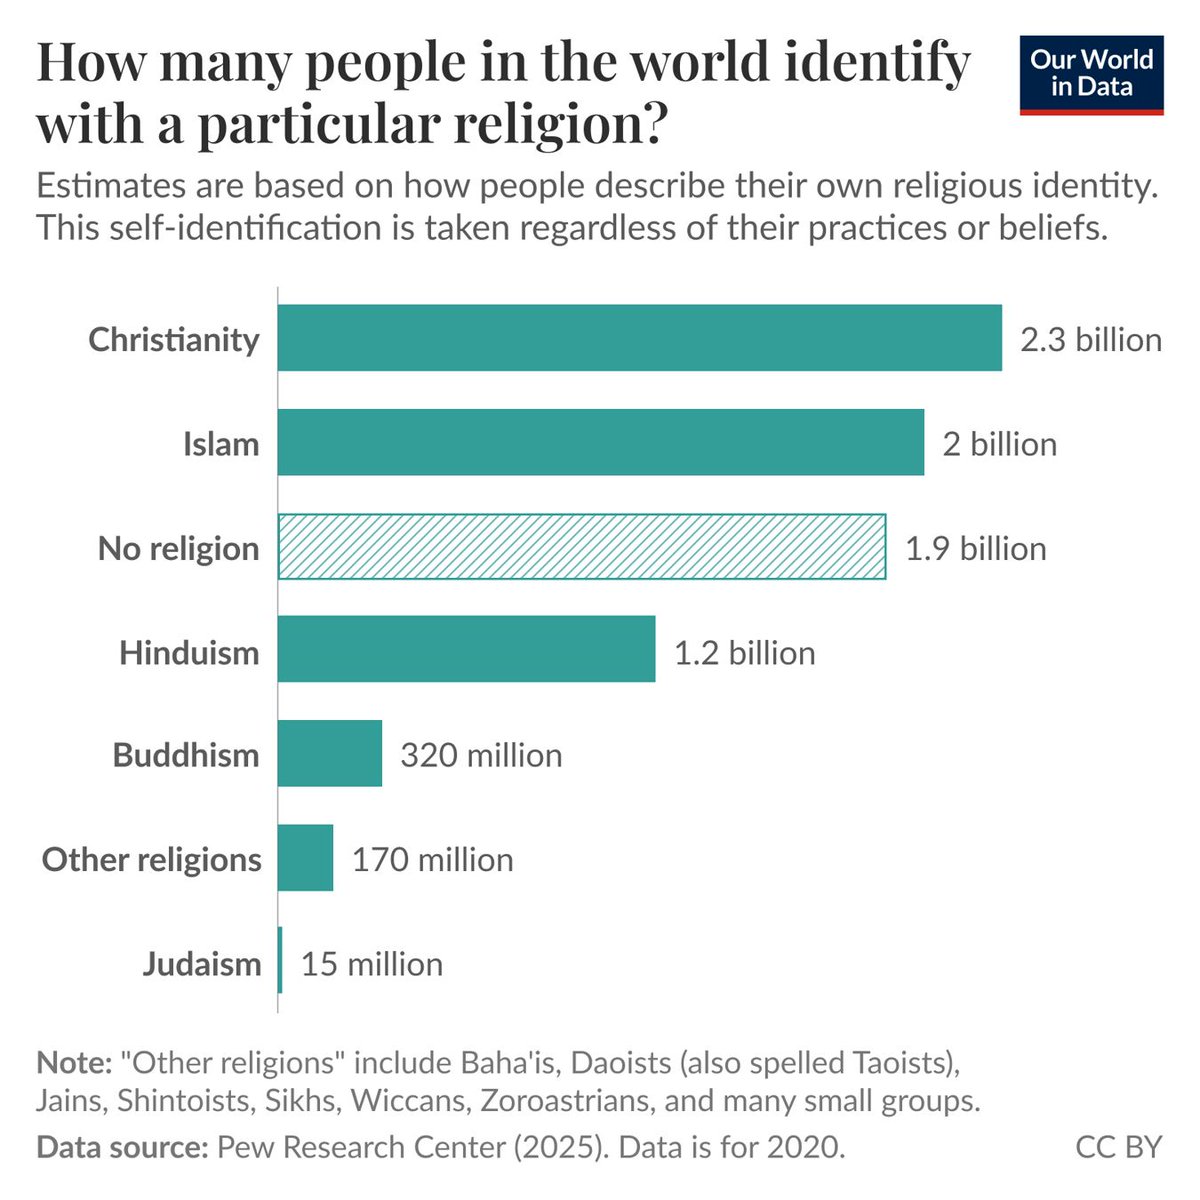
The Pew Research Center publishes estimates of religious affiliation across the world. You can see the global breakdown in the chart for 2020 (the most recent year available). It shows the number of people who identify with each religion. Pew counts people by the religion they report, regardless of their beliefs or practices.
You can see that Christians are the largest group, with 2.3 billion people, followed by Muslims, with 2 billion. People with no religious affiliation come close behind.
Those not affiliated with any religion are among the largest groups in the world. But this undersells religion’s reach: when we add up all religious groups, most people in the world — around three in four — identify with a religion. Those with no religious affiliation are still a minority.
(written by @_HannahRitchie)
A couple of decades ago, the chances of surviving more than ten years with the human immunodeficiency virus (HIV) were slim. Today, thanks to antiretroviral therapy (ART), people with HIV/AIDS can expect to live long lives. ART is a mixture of antiviral drugs that are used to treat people infected with HIV. It is an essential player in making progress against HIV/AIDS because it saves lives, allows patients to live longer, and prevents new infections.
Since the first version of ART was introduced in the late 1980s, the treatment has saved millions of lives. The chart shows the annual number of deaths from HIV/AIDS and the number of deaths averted as a result of ART. Today, a person living in a high-income country who started ART in their twenties can expect to live for another 46 years — that is, well into their 60s.
There is considerable evidence to show that people who use ART are less likely to transmit HIV to another person. ART reduces the number of viral particles present in an HIV-positive individual, and therefore, the likelihood of passing the virus to another person decreases. In 2011, the journal Science named as its “Breakthrough of the Year” a study that found that ART reduced the risk of HIV transmission between couples by 96%.
The number of people who receive ART has increased significantly in recent years. But to make progress against HIV/AIDS and fully benefit from the potential of ART treatment, we need to increase HIV/AIDS awareness and improve access to ART.
If you want to be a part of this historic change, read Max Roser's brief article on how you can contribute to humanity’s battle against malaria: https://t.co/tweGYSlHmP
Other sources & data:
https://t.co/1ythSqCQDC
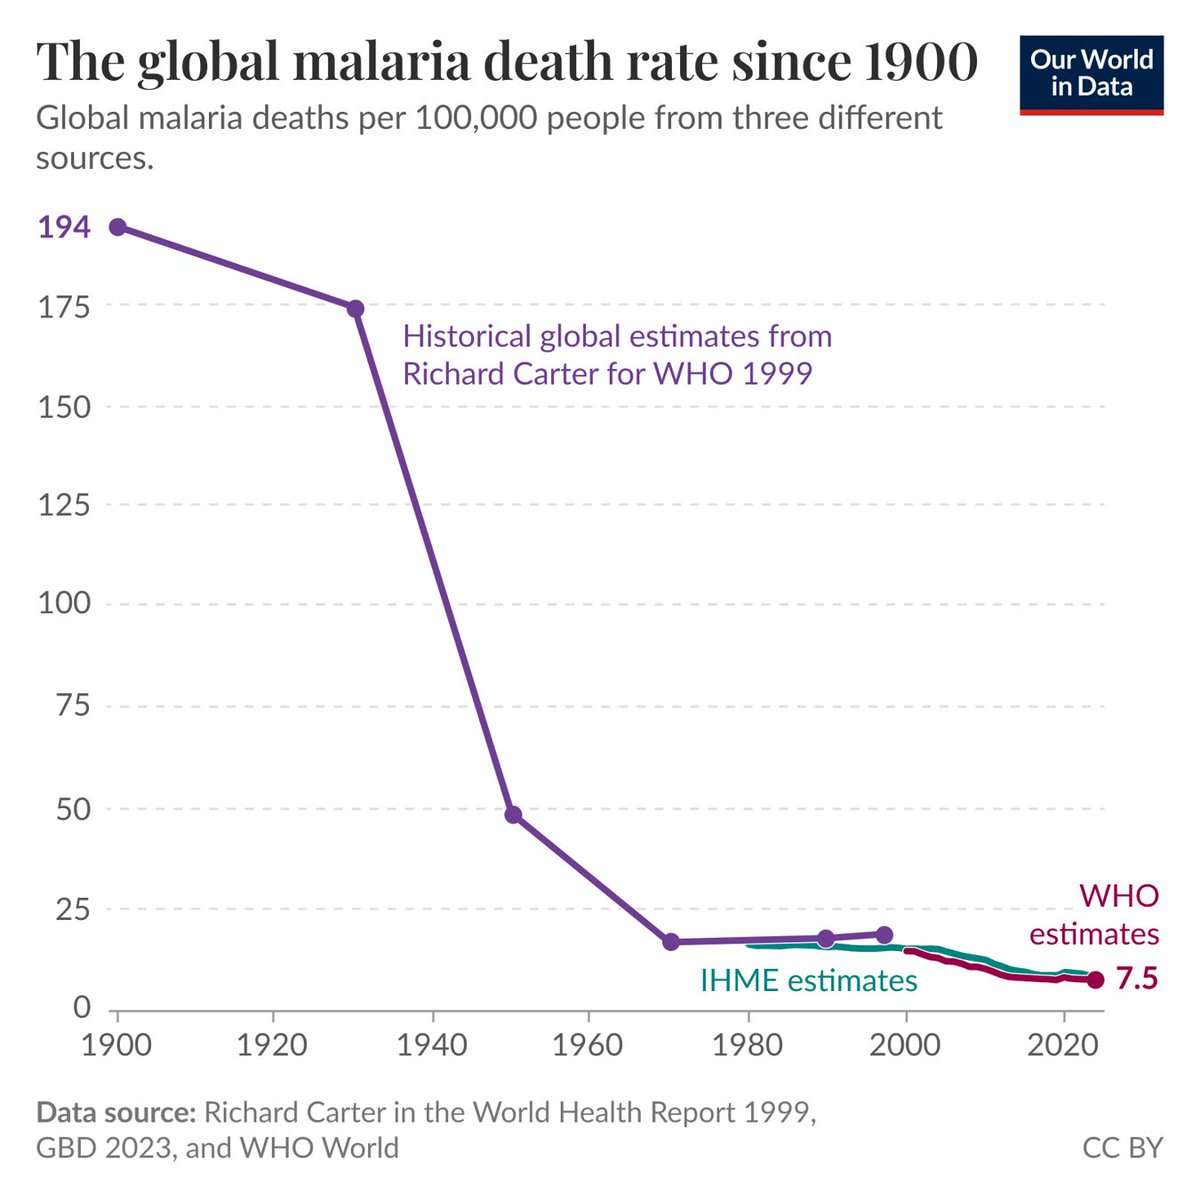
A long-term perspective on humanity’s battle against malaria.
According to the latest data from the World Health Organization, the global death rate from malaria has almost halved since the year 2000.
The chart above puts this recent progress into a larger historical perspective. It combines the latest estimates from the WHO and the Institute for Health Metrics and Evaluation with those for the 20th century published by the late malaria researcher Richard Carter. Since 1900, the global death rate has declined by 96%. If it were still as high as it was then, around 16 million people would die from malaria every year instead of 610,000.
Behind this long-run decline is a shift in the distribution of the burden of malaria. In the first half of the 20th century, most malaria victims died in the Asian tropics. It was the substantial progress there — as well as in the Mediterranean and in the Americas — that made this vast improvement in human health possible.
Today, more than 9 out of 10 malaria deaths occur in Africa. This means that the recent progress shown in the chart is, above all, Africa’s progress.
(written by @MaxCRoser)
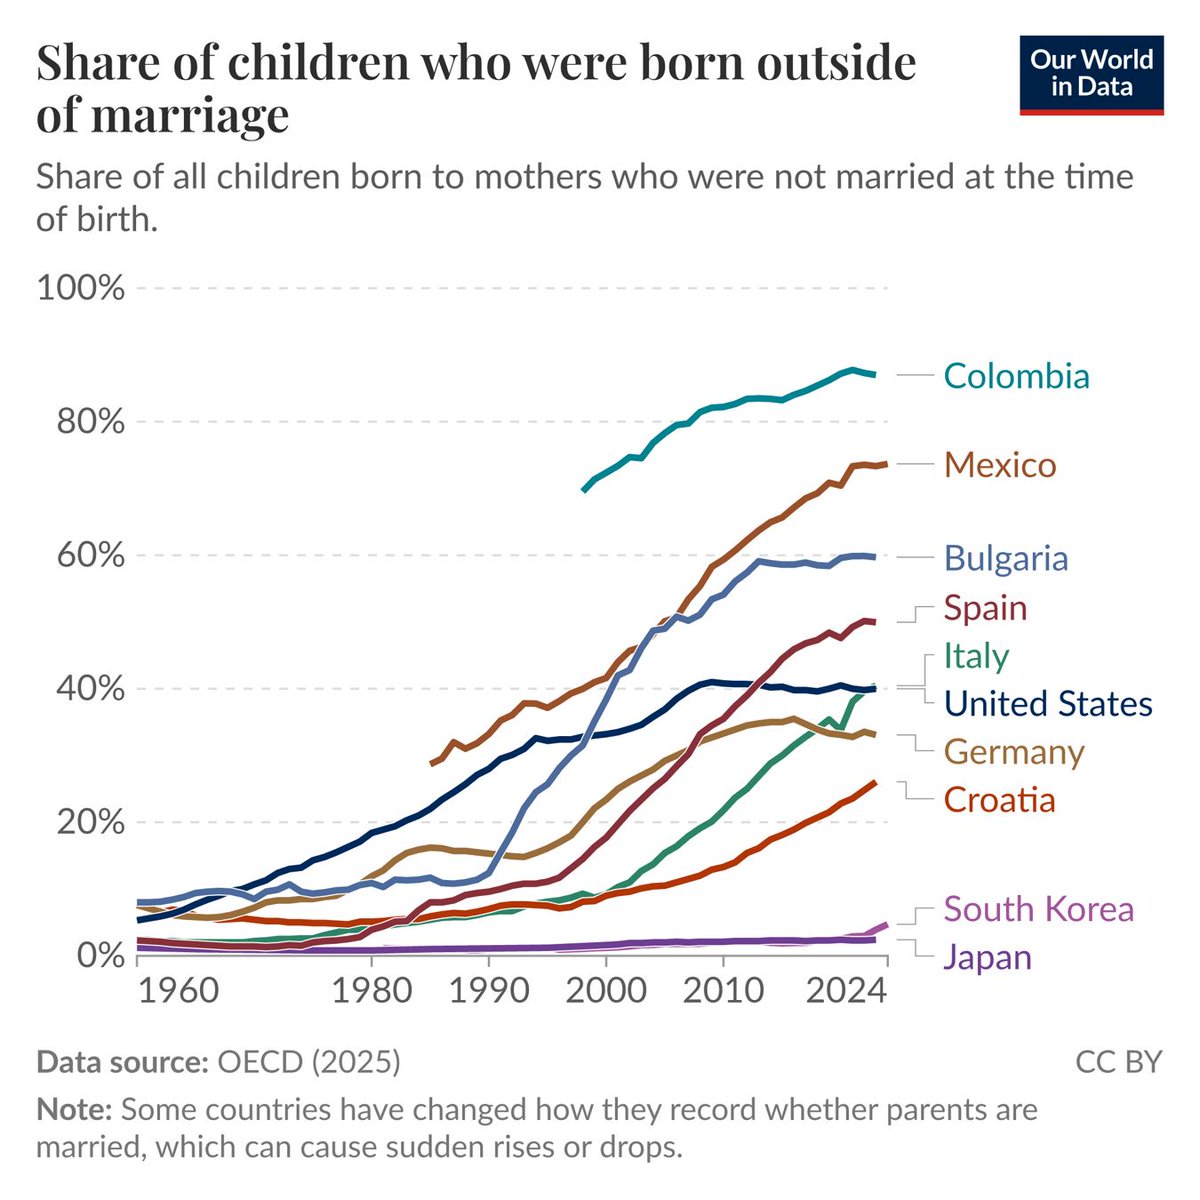
How has the share of children born outside of marriage changed?
The Organisation for Economic Co-operation and Development (OECD), a group of 38 mostly high-income countries, brings together data on family life and family policy in its Family Database, which covers its members, EU countries, and some partner countries.
One of its indicators is the share of children born outside of marriage, meaning births where the mother was not legally married at the time. The OECD collects these figures from national statistical offices and Eurostat.
In 1970, fewer than one in ten children were born outside of marriage in 20 of the 25 countries with data for that year and 2023. The share has risen in all 25 since then — in Spain, it went from 1.4% to 50%.
Most countries don’t have long-term figures on how many couples live together unmarried, which makes this indicator one of the few ways to follow that change over decades.
We recently updated the chart with the OECD’s release from October 2025. For most countries, the data used to end in 2020 and now goes to 2023, and to 2024 for five of them. Colombia is in the data for the first time, from 1998 onward, and has the highest share of all. In 2023, 87% of births there were to mothers who weren’t married.
(This data update was led by @redouad.)
Explore progress against poverty across the world in our data explorer: https://t.co/vIEjxe85lY
Other sources & data:
https://t.co/kceFf1559E
https://t.co/F4G9TxrmWS
https://t.co/7MkvsCGBn4
China reduced extreme poverty fast, but Indonesia hasn’t been far behind.
China is often the poster child for rapid reductions in poverty, and for good reason. In the early 1980s, over 90% of its population lived in extreme poverty, but by the early 2020s, that number had dropped to nearly zero.
Some might assume that China is the only reason why global extreme poverty has declined. But that’s wrong: many countries have seen dramatic reductions in poverty, too. Indonesia is one clear example; it’s shown alongside China on the chart.
In 1984, 86% of Indonesians lived on less than $3 per day. By 2025, this had fallen to less than 4%. While it didn’t quite match China’s decline, it has still been impressive. The number of people living in extreme poverty has fallen from 140 million to about 10 million.
Note that the international poverty line is extremely low, defined as people living on less than $3 per day. But Indonesia has also made progress when measuring higher poverty lines.
(written by @_HannahRitchie and @parriagadap)
What share of plastic waste ends up in the ocean?
Many of us will have seen the stark images of plastic in the ocean: bottles and wrappers clumped together, or rubbish trapped along the coastline. But how much of the world’s plastic waste ends up in the ocean?
In 2020, Gapminder asked people in Sweden, Norway, Finland, Denmark, and the UK this question. They had three options to choose from:
Almost nine in ten people picked B or C, thinking it was more than one-third.
The correct answer was A: around 0.5% of plastic waste ends up in the ocean.
The chart shows how the OECD gets to this number. Globally, we produce around 350 million tonnes of plastic waste a year. Most of this is managed responsibly, either in secure landfills, through recycling, or incineration. But around one-quarter of it is mismanaged or littered.
From there, a decreasing fraction of plastic waste leaks to the environment, then into rivers and coastlines, and finally into the ocean. Around 1.7 million tonnes end up there: around 0.5% of what was generated in the first place.
People tend to think that most of our plastic ends up there, but only a tiny percentage does. This should make plastic pollution an easier problem to solve: we already know how to manage most of it well. The challenge is to ensure that all plastic is handled this way.
(written by @_HannahRitchie)
Habitat loss is the biggest threat to the world’s wildlife. Nearly all habitat loss is driven by the expansion of agriculture: we chop down forests and convert wild grasslands into farmland to grow crops and raise livestock.
Researchers David Williams, Michael Clark, and colleagues mapped out what the future of agricultural expansion and habitat loss might look like. In their business-as-usual scenario, crop yields continue to increase at rates similar to those in the past, and by 2050, the world will need 26% more cropland — an area the size of India and Germany combined. Cropland expansion would be intense across sub-Saharan Africa. The researchers mapped the changes in habitat area for 19,859 species of mammals, birds, and amphibians. Nearly all (88%) of these species would lose at least some of their habitat by 2050.
The researchers also assessed the most effective changes we can make to limit the impact on the world’s wildlife: closing yield gaps, so that crop yields reach 80% of their estimated maximum potential; halving food waste and losses; shifting toward a plant-rich (but not vegan) diet; and optimizing trade. If we combined all four of these changes, all regions would see mean habitat losses of 1% or less by 2050.
What stands out across the individual changes is the dramatic impact that closing yield gaps has, particularly across sub-Saharan Africa. If we were able to close these gaps, mean habitat losses across sub-Saharan Africa would be just 1%.