2. chart of the day:
Another great setup in the market atm. NU Holdings - $NU
Take a look on the chart. The red zones highlight price levels with high trading volume.
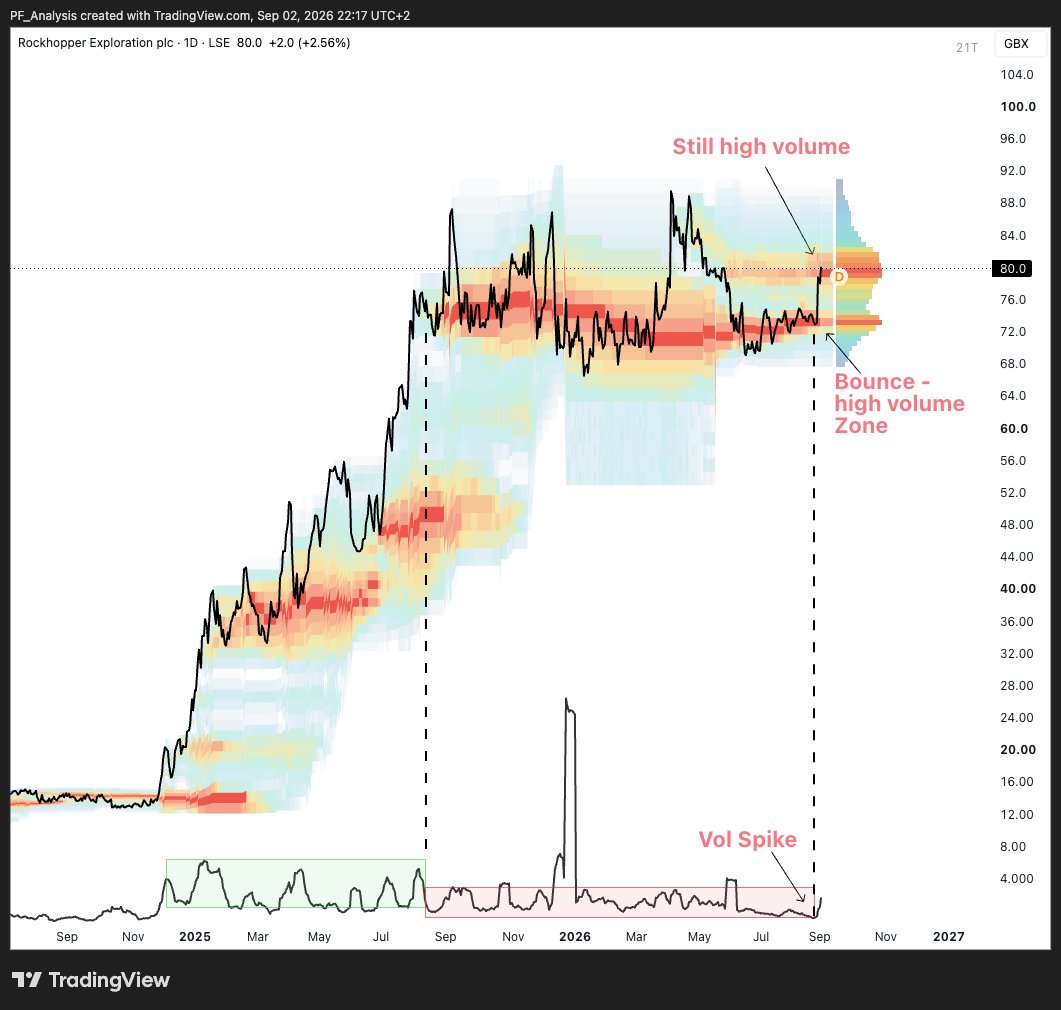
One of my favorite setups in the market right now. A oil & gas developer - Market Cap: 676M GBP. $RKH.
Rockhopper Exploration:
Take a close look on the chart. The red zones highlight price levels with high trading volume.
$SOFI | $16.68 | –5.98% today 📉
Descending triangle meets major support (~$16). The volume cluster on the right confirms this zone is heavily contested. Decision point approaching: breakout or breakdown?
The question mark in the chart says it all. 🔎
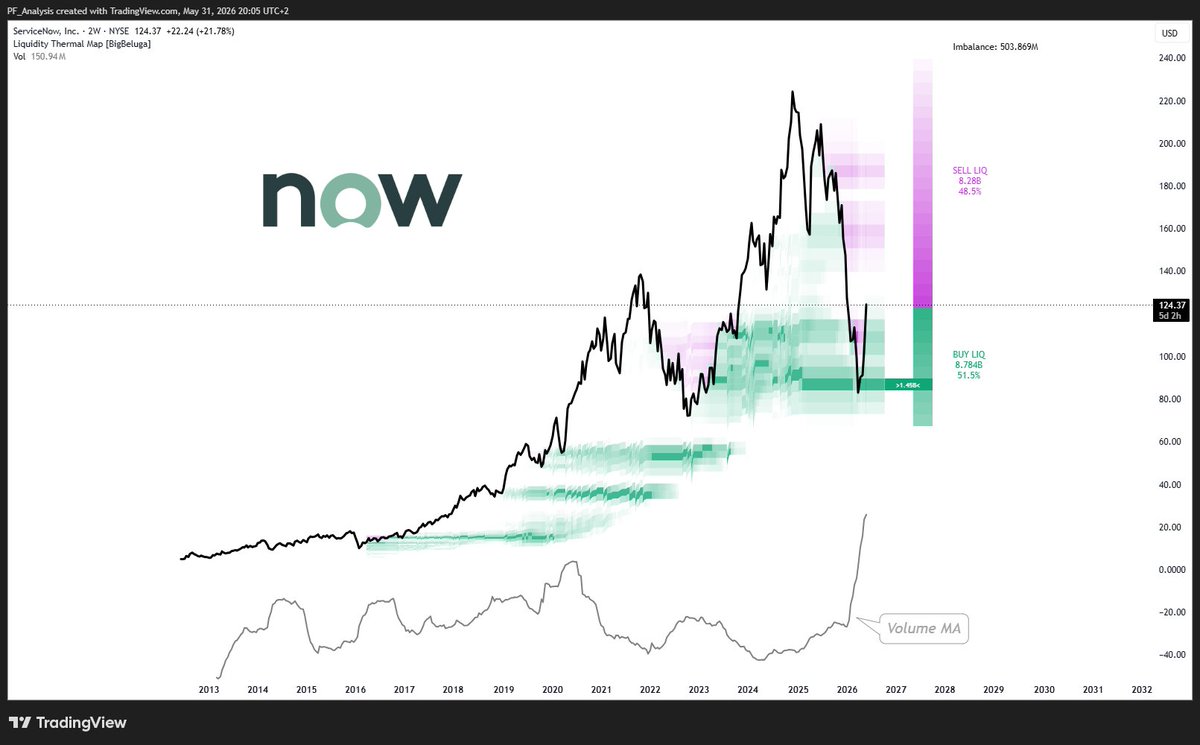
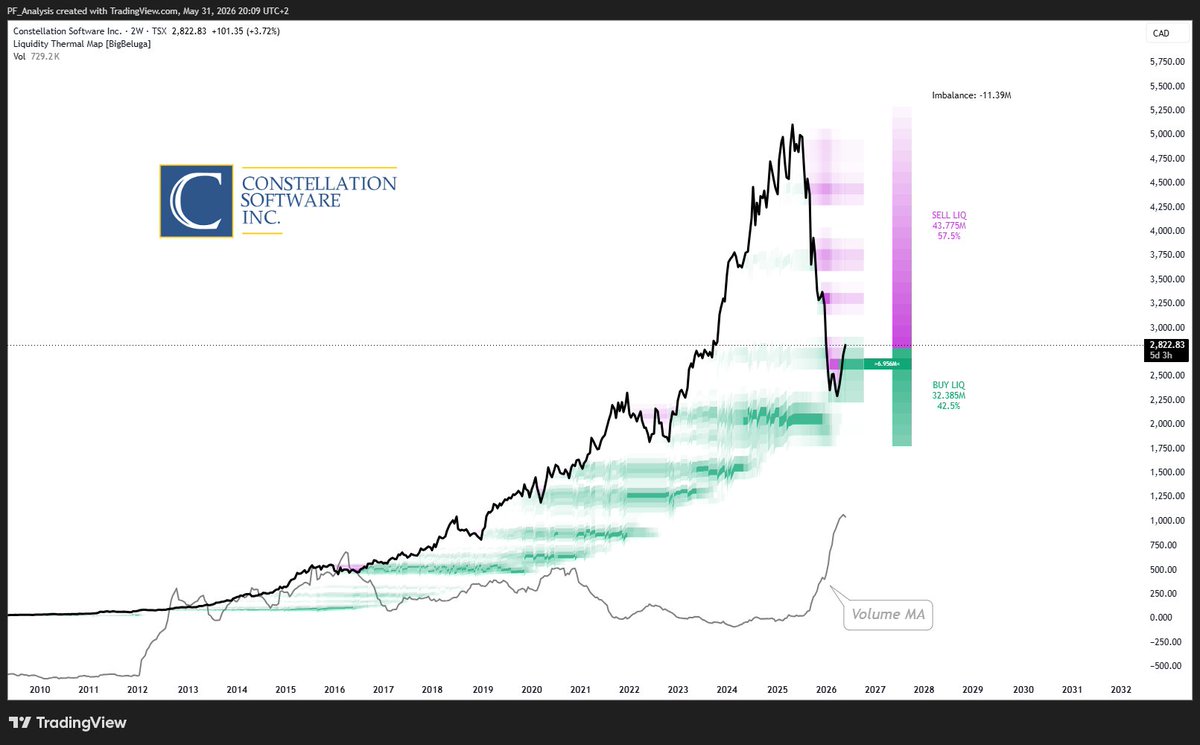
3 software compounders, 1 pattern: $CSU, $TOI & $NOW all sit ~40–50% below their 2025 highs. Market fears AI will eat software — yet Q1 beats & double-digit growth say otherwise. On the charts all three are turning at support, $NOW with the strongest buy-side imbalance.
Technically at a decision zone. Fundamentally strong, but macro-dependent.
Rate cuts → multiple expansion likely. Further hikes → pressure remains.
Not financial advice. Do your own research. 🧠
$SOFI | $16.68 | –5.98% today 📉
Descending triangle meets major support (~$16). The volume cluster on the right confirms this zone is heavily contested. Decision point approaching: breakout or breakdown?
The question mark in the chart says it all. 🔎
CEO Noto continues open market purchases. Tangible Book Value: $7.20 → Multiple: ~2xNew growth drivers with zero revenue yet: SoFi USD (Mastercard deal), SoFi Plus (160k paying members in 6 weeks), Big Business Banking (July launch).
3 software compounders, 1 pattern: $CSU, $TOI & $NOW all sit ~40–50% below their 2025 highs. Market fears AI will eat software — yet Q1 beats & double-digit growth say otherwise. On the charts all three are turning at support, $NOW with the strongest buy-side imbalance.
MSCI isn't a growth trade — it's a toll-road business on global capital markets.
Every new ETF, every new emerging markets fund pays a license fee. No capex. ~95% retention rate.
Rarely does quality show up this clearly in a chart.
Q1 2026: Revenue $850.8M (+14% YoY). Net income +41%. EPS $5.54 vs. $3.72 a year ago — both above estimates.
Asset-based fees +26.6%. Run Rate >$3B.
The liquidity heatmap shows volume accumulating in a wide base since 2022. Breakout is underway.
MSCI sells the infrastructure the global investment world runs on: indices (basis for ETFs with trillions in AUM), risk analytics, and ESG data.
The model: recurring subscriptions + asset-based fees — MSCI earns more as AUM grows.
Adj. EBITDA margin: 60%+.
Clean Energy Stocks have been moving in sync with expansion and contraction in Banks Balance Sheets + FED Balance Sheet. Liquidity goes up → “Green Energy” ETF goes up. Liquidity gets cut → ETF gets crushed. Now the latest liquidity surge is pushing it higher again…