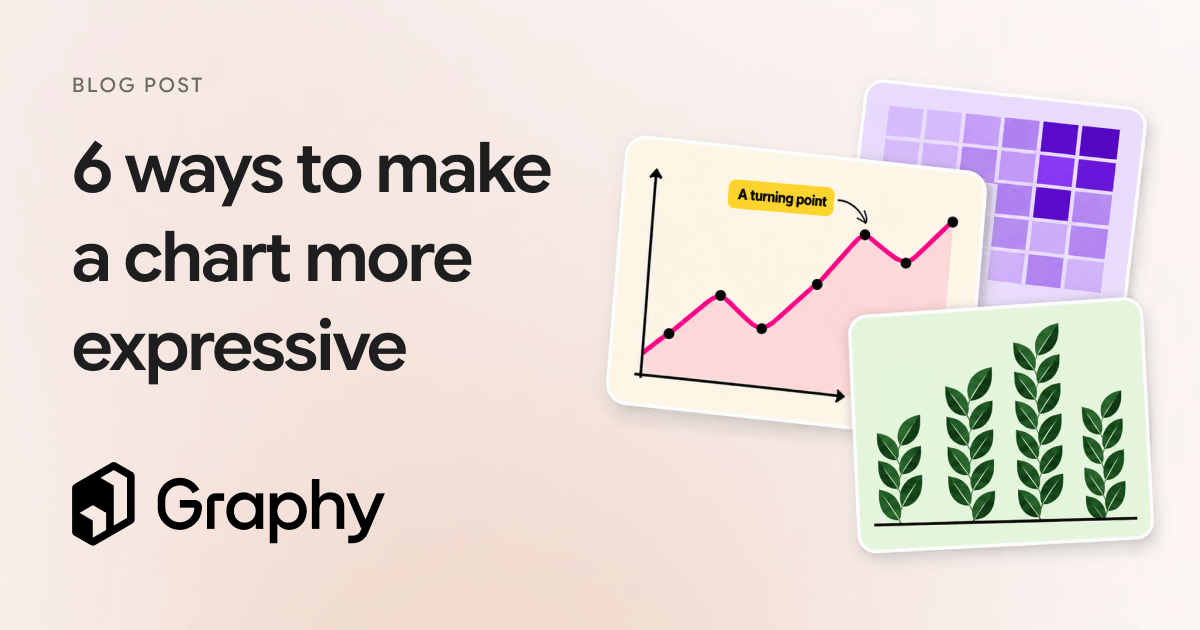
There’s room to get more creative with the charts in your product.
Here are 6 ways to make charts more expressive, from colour and annotations to custom shapes, with before-and-after examples built in Graphy.
https://t.co/dEeqKs7AWX
#datastorytelling#dataviz#productdesign
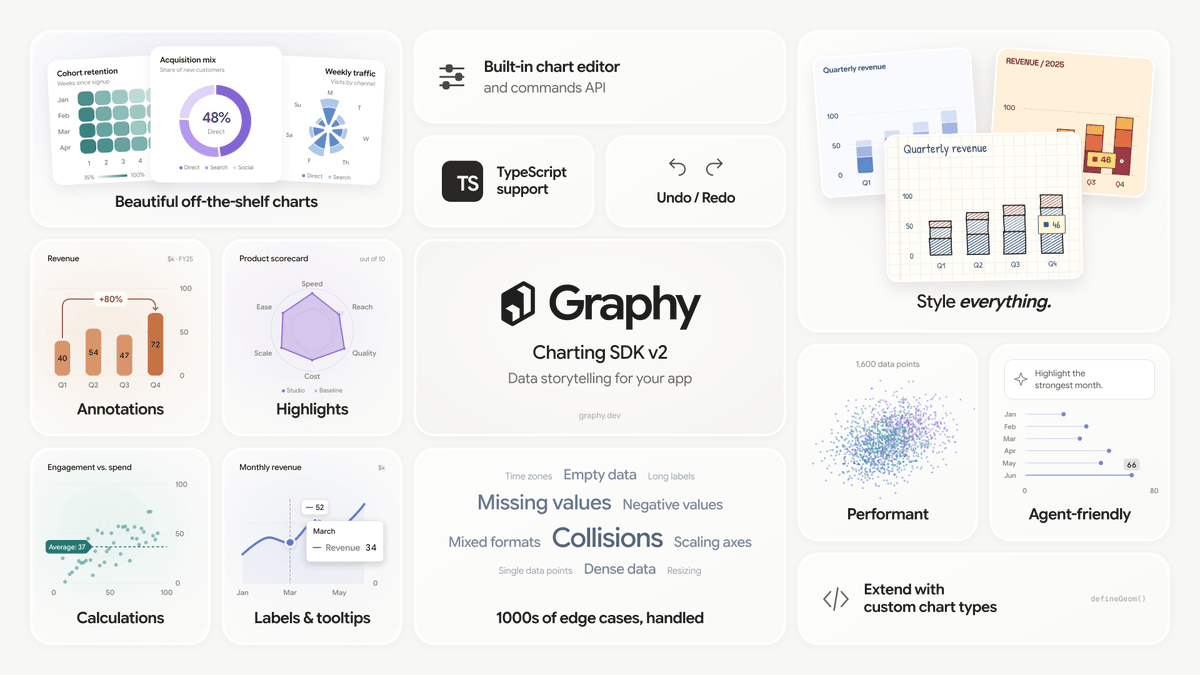
We've spent years helping people turn data into stories. Now we're putting that experience in your hands.
Introducing v2 of Graphy's Charting SDK: expressive visualisations, custom styling and storytelling tools for the products you build.
🔗 https://t.co/b7MkpBB2A9
We wanted to know if Graphy can run DOOM. Turns out that with creative use of our heatmap visualisation, the answer is 'yes it can'!
Each frame is an individual heatmap made from 36,000 data points, redrawn quickly enough to play. Goodbye Friday... https://t.co/Yj28Ydvcxo
We're working on an X bot for a hackathon that produces charts on demand, and we're looking for beta testers.
Just mention @sirplotsalot and have a go!
@SirPlotsalot Our knight has a quest! Visualize 'Developer Velocity vs. Code Debt' for 2026. Make the 'Debt' bar look as scary as a dragon. #GraphyStyle