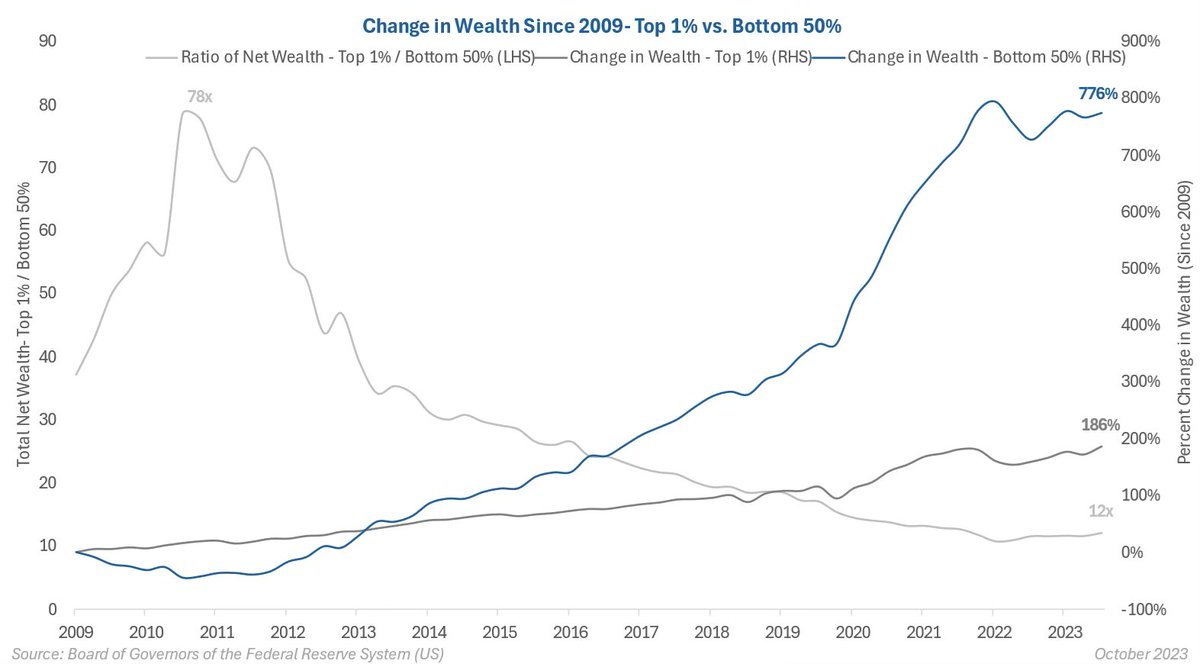
@chigrl The wealth gap is huge, but has closed considerably. Since ‘09, increase in wealth…
Top 1% = +186%
Bottom 50% = +776%
Top 1% / Bottom 50% = 78x (‘10) > 12x (‘23)
The bottom 50% took it on the chin in ‘08, so coming off a low base. Also, been flat for 2 years.
@dampedspring@chamathGundlach Why are they so attractive for the issuer? Is it just the commission? Or is there another source of profit embedded in them?
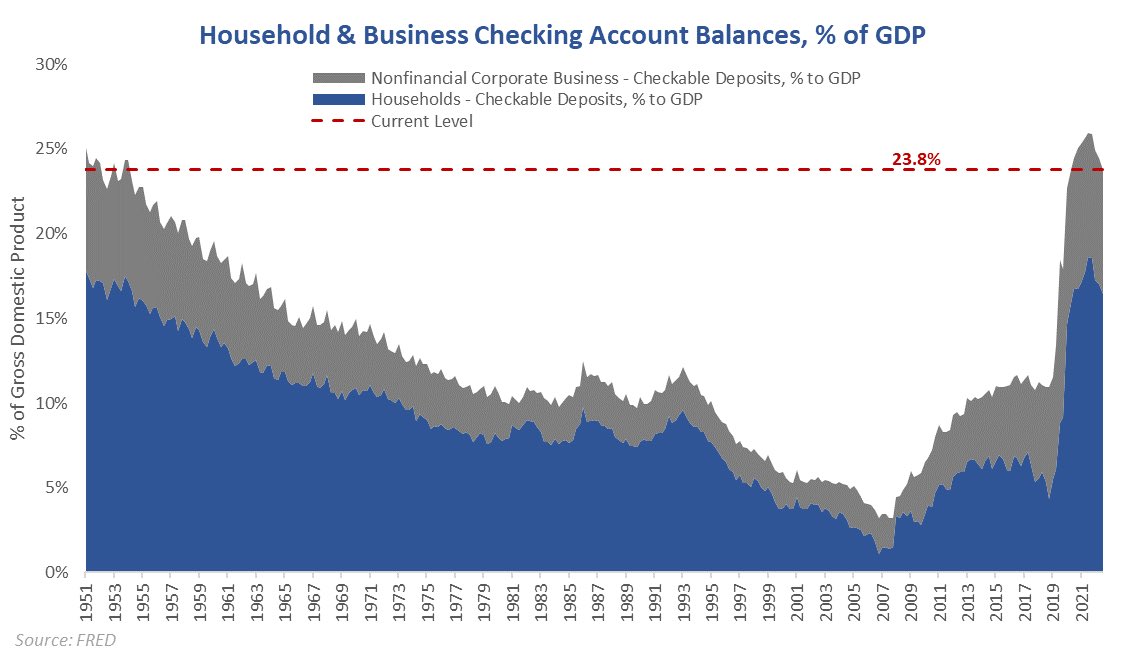
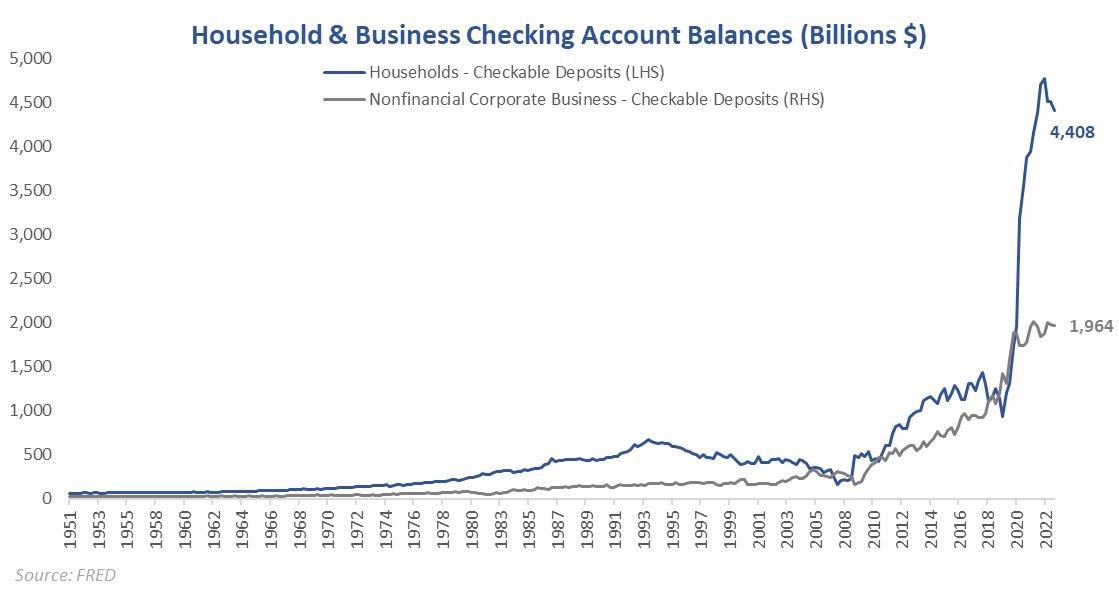
@saxena_puru I struggle to square this data with checking account balances. Roughy $6.3T at the end of 2Q (HH + business). Nearly 25% of GDP - highest since 1950’s.
S&P 500 earnings estimates appear very optimistic given the macro backdrop.
ISM Manufacturing firmly in contraction territory while EPS estimates assume +10% EPS growth in 2023 & 2024.
$SPY $SPX
S&P 500 earnings estimates appear very optimistic given the macro backdrop.
ISM Manufacturing firmly in contraction territory while EPS estimates assume +10% EPS growth in 2023 & 2024.
$SPY $SPX
S&P 500 earnings estimates appear very optimistic given the macro backdrop.
ISM Manufacturing firmly in contraction territory while EPS estimates assume +10% EPS growth in 2023 & 2024.
$SPY $SPX
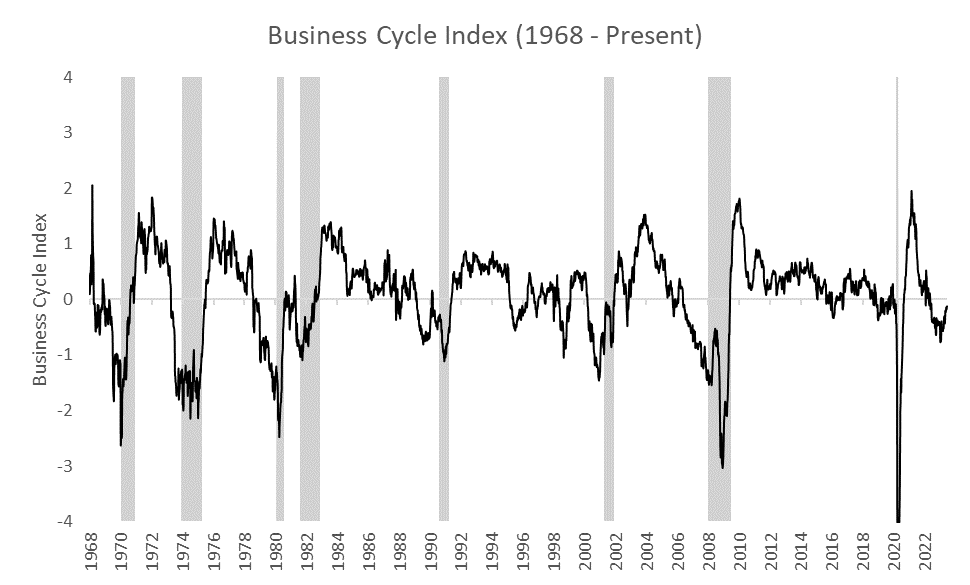
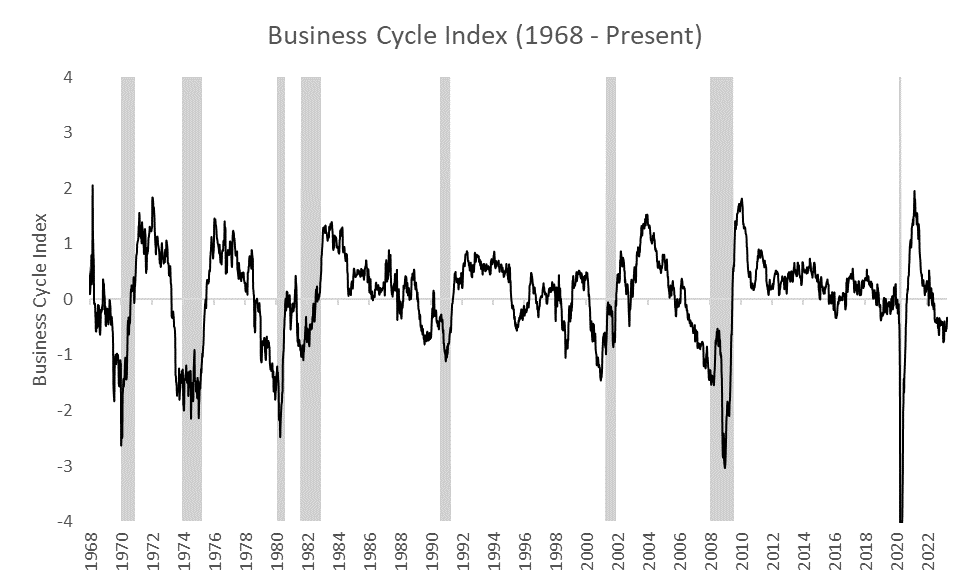
Business Cycle Index ticked higher last week, moving further away from levels seen during prior recessions.
Coupled with this morning's jobs report, the Fed may have to hike more than the market currently expects.
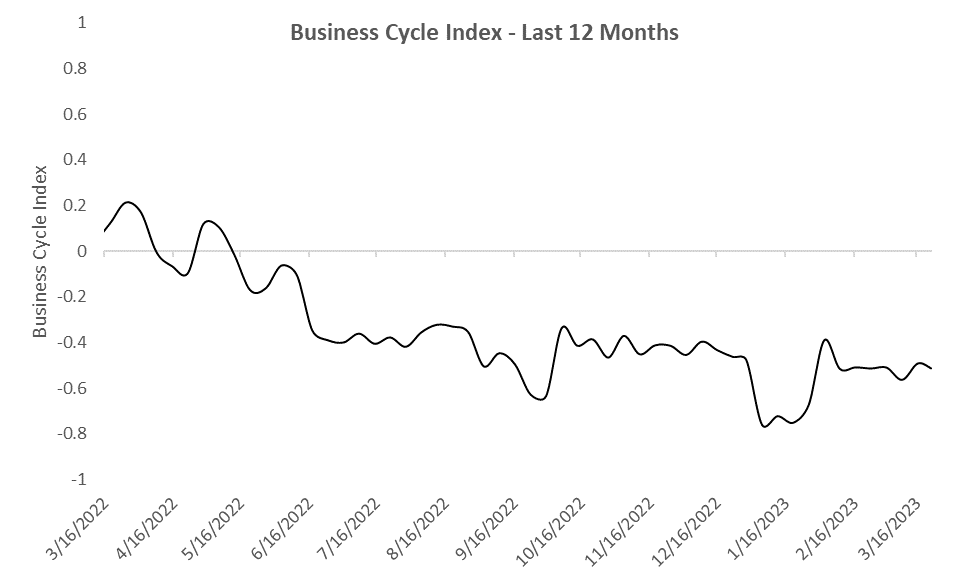
Business Cycle Index (BCI) update:
Last week's strong building permits data offset widening credit spreads. Still firmly in negative territory, but not (yet) at levels consistent with prior recessions.