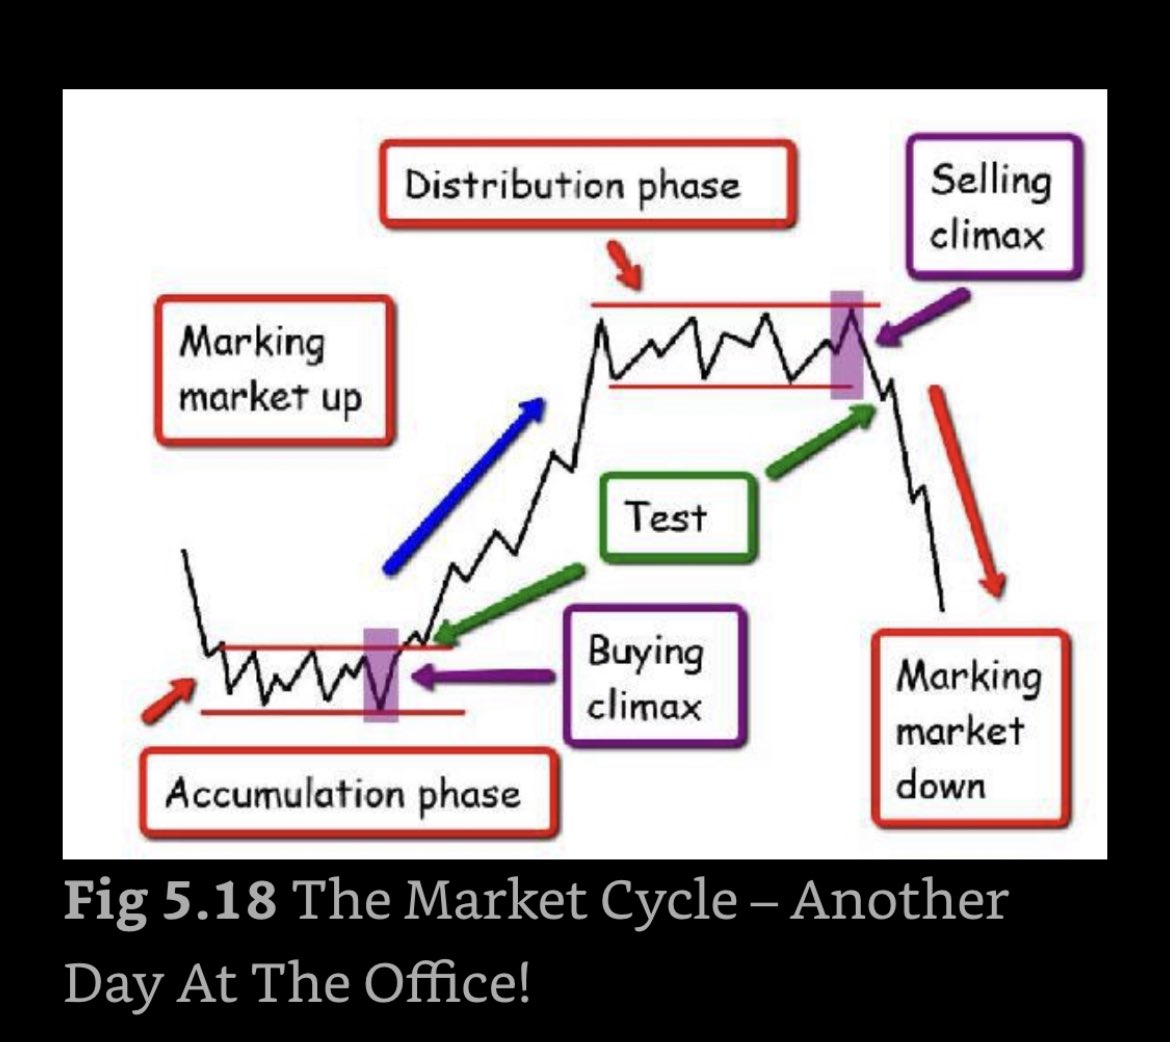
here it’s showcased, and this idea works both ways. notice how after the test was successful the market moved dramatically in the way the market makers (insiders) wanted it to
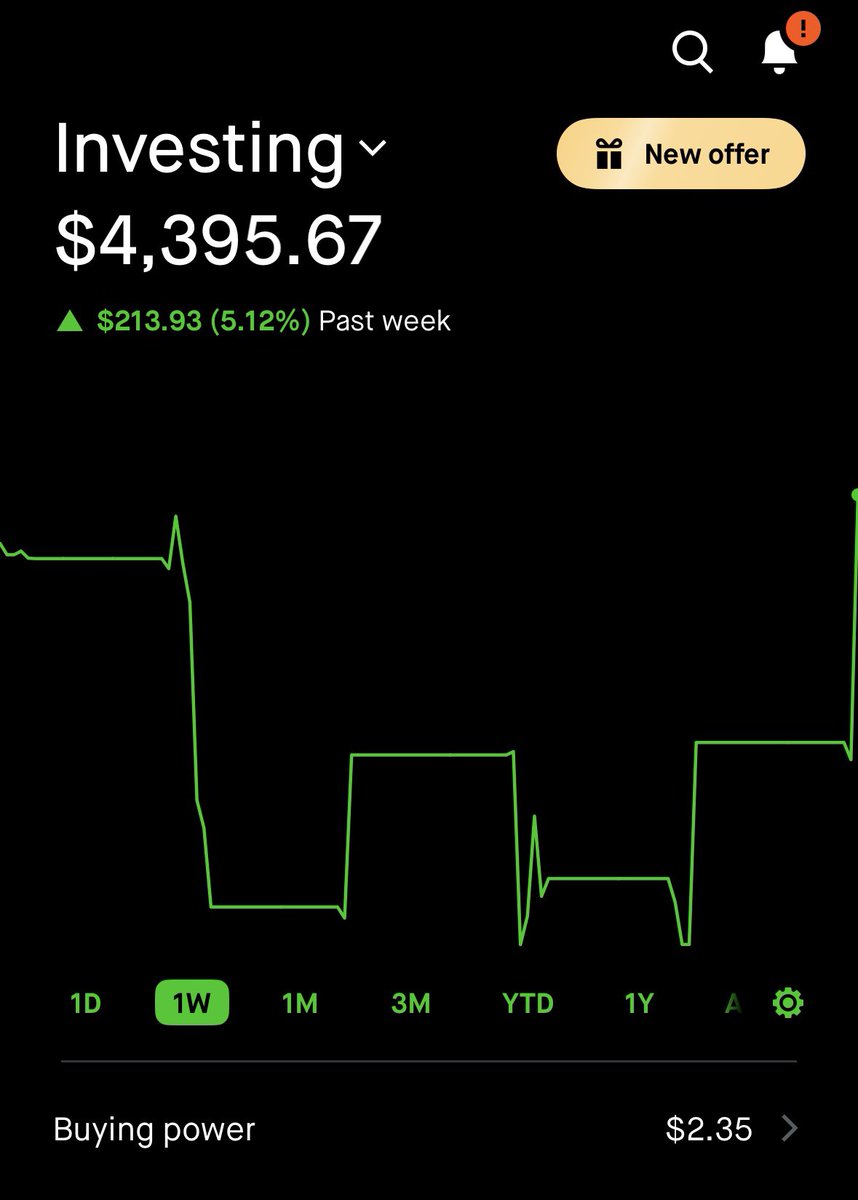
I haven’t traded every day and put some of the BP into equity incase I do something stupid and lose it all. I could have made a lot more if I held but don’t want to play the what-if game especially when I made $1k today, greed is a killer
From those from Reddit, I haven’t had time to post more educational threads, I’ll try when I do have time.
If you’re wondering the progress from $50 we currently sit at $5.5k, last week I made two really bad trades and lost quite a bit but managed to end last week green still
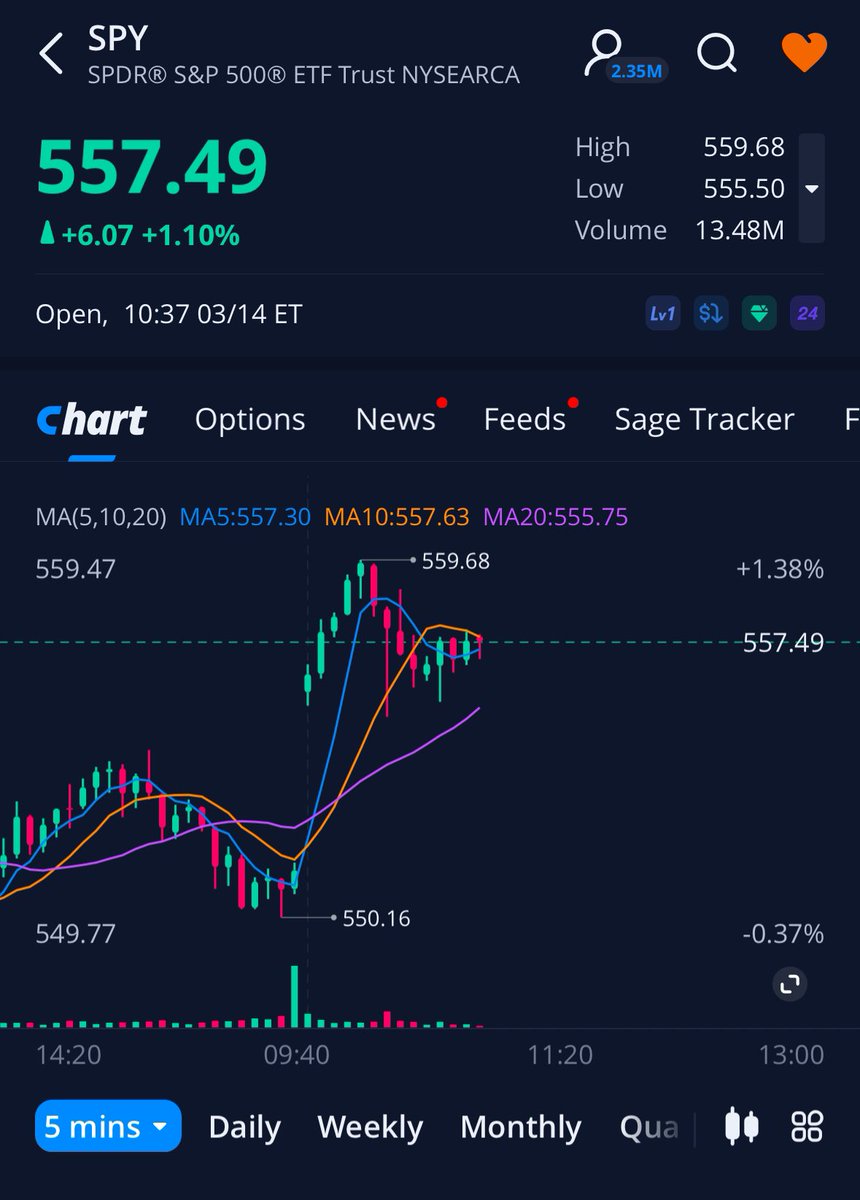
@Synchroid1 I use 10 & 20 SMA
You can add 5 too for soft support/resistance but not needed
If you want to long term trade you can add more like 50 and 100
@Synchroid1 It’s important to note though that on opening volume is going to be significantly higher than rest of day. Also falling volume doesn’t always mean weakness
An example would be in an uptrend, a small candle has small volume, this doesn’t signify weakness always so we have to wait
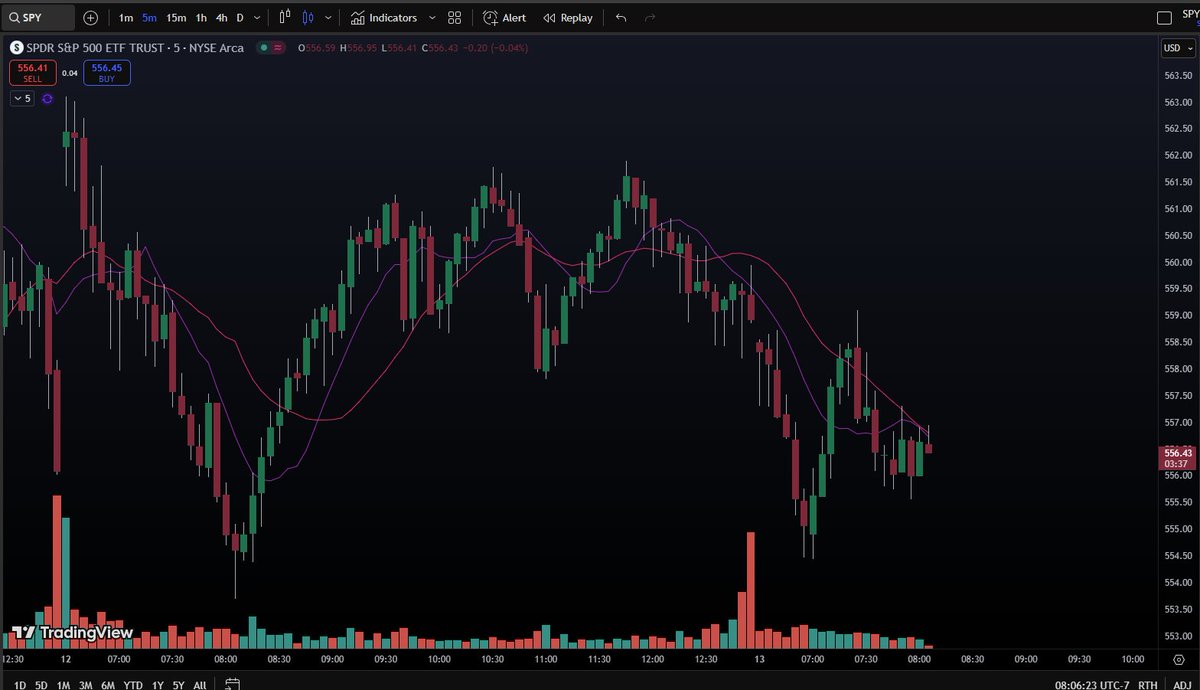
@Synchroid1 Yeah so pretty much that, what I’m looking for is validation of the moves. I’m looking mostly for candles at resistance with lower volume than the previous candle.
For example with this trade I see resistance and volume fading to lower and lower