AI-powered Data Visualization Platform. Our mission is to make data visualization simpler, faster, and smarter by leveraging the latest advancements in AI. 🚀
Prices in Switzerland have basically stopped moving. They literally have. Headline inflation is 0%. Core is flat. Monthly consumer prices are hugging the zero line. While people in the UK, Europe and the US are still watching food, fuel and rent climb, Switzerland is living in a different inflation cycle entirely. Not a lot of people know that. I do because I live here.
Start Creating Your Charts Now: https://t.co/lzhQFWBCQf
Public patience with chancellors tends to ebb and flow yet it rarely collapses. This chart shows something different. Only 11% of those surveyed by Ipsos Political Monitor are satisfied with Rachel Reeves. That is the lowest reading for any chancellor in nearly 50 years of Ipsos data.
Created by PlotSet
https://t.co/lzhQFWBCQf
This looks like another tech rout, but this chart tells a more interesting story. Returns over the past month are not moving in one direction, they are spreading out.
Try PlotSet Now: https://t.co/l6n81HS5u4
China has surpassed the United States in monthly downloads of artificial intelligence models, marking a major turning point in the global AI race. Have a look at the chart. It did this in less than two years.
Nvidia has hit $5 trillion in market value. It's the first company in history to do that. It announced a $1 billion investment in Nokia to help build AI powered telecommunications infrastructure. The partnership aims to digitalize the global network backbone, embedding AI into 5G and 6G systems that connect the world. If Nvidia supplies the data centers and the network gear in this deal, it gets paid in both places. Nvidia gets paid twice! That's why markets are excited.
Microsoft crossed $4trn in market cap. But Nvidia is already at $4.7trn. These are different stories. Nvidia's trajectory is vertical after 2022 due to its chips that power AI. Microsoft's path is steadier, providing the infrastructure for AI. Made with https://t.co/7frkDSlZp9
Measured at purchasing power parity, China’s economy has overtaken the US and continues to widen the gap. From just over $1 trillion in 1990, China’s PPP-adjusted GDP has surged past $37 trillion, compared with around $30 trillion for the US.
PPP adjusts for price differences across countries, giving a clearer picture of the real size of economies. By this measure, China became the world’s largest economy in 2016 and has since pulled further ahead. Its expansion reflects decades of rapid industrialisation, export-led growth and infrastructure investment, while the US has grown more steadily from a higher base.
China’s economic dominance in PPP terms doesn’t necessarily translate into financial or geopolitical dominance. Much of its wealth is concentrated domestically, and per capita income still lags far behind advanced economies. But it does underline a profound shift in the balance of global economic weight.
Do you think PPP is the best way to measure economic power in today’s world? There are some critics as well as fans of this measure.
💔 The true human cost of war…
This chart reveals which regions have suffered the most deaths from conflict since 1989.
⬇️ Get this chart for FREE: https://t.co/GIkNxF4Q2c
#War#Conflict#GlobalTrends#DataViz#PlotSet
💥 Which countries spend the largest share of their economy on the military?
⬇️Get this chart for FREE: https://t.co/LCgxgH4F9b
One nation’s number will leave you stunned 👇
#MilitarySpending#Geopolitics#DataViz#PlotSet
💰 Which countries are truly the richest in the world by GDP per capita?
⬇️Get this chart for FREE: https://t.co/OzDJh1EKJ8
The results may surprise you 👇
#Economy#GDP#DataViz#GlobalProsperity#PlotSet
🌍 Did you know millions of people still live on less than $3 a day?
Here are the countries where extreme poverty is alarmingly high.
⬇️Get this chart for FREE: https://t.co/TY5ADH4n4K
📊 Watch the full chart 👇
#GlobalPoverty#DataViz#PlotSet#Economy#Inequality
💰 How much does your country really spend on healthcare?
Some nations are investing way more than you might expect.
Watch the full breakdown 👇
Get this chart for for FREE: https://t.co/m8OOv0t1za
#HealthCare#DataViz#PlotSet#Economy#PublicHealth
🚀 Who’s Winning the Space Race?
65 years of launches… one country soars far above the rest.
Can you guess who?
📊 Made with @plotset → https://t.co/p8i6y0kyM8
🔗Data Source → https://t.co/JnxSMHgonQ
⬇️Get this chart for FREE → https://t.co/hoLTqxvVZL
#SpaceRace #SpaceExploration #NASA #PlotSet #DataViz #SatelliteLaunches #AnimatedCharts
Which country sells the most electric cars?
2023 leaders (% of all car sales):
🇳🇴 Norway : 91.6%
🇸🇪 Sweden : 58.4%
🇧🇪 Belgium : 52.3%
🇩🇰 Denmark : 51.5%
🇫🇮 Finland : 49.6%
🇳🇱 Netherlands : 48.4%
📊 Made with @plotset → https://t.co/lzhQFWBCQf
⬇️Get this chart for FREE → https://t.co/ayy6Cn5U6m
🔗Data Source → https://t.co/2blAtFpyQ2
#ElectricVehicles #EVSales #Sustainability #EVMarket #DataViz #PlotSet #CleanEnergy #AutomotiveIndustry
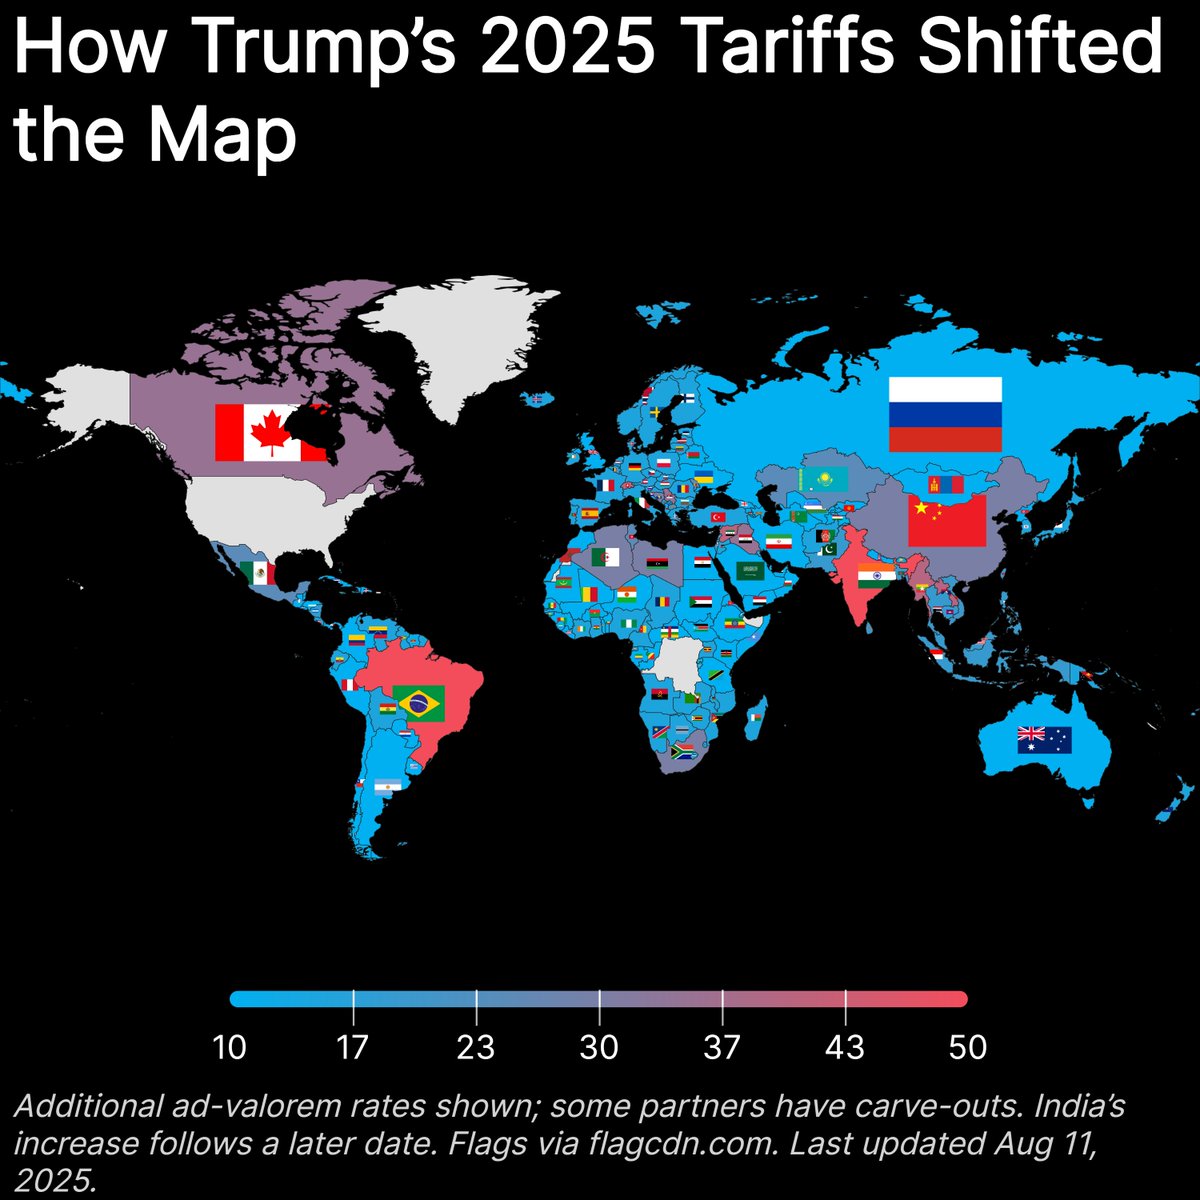
How Trump’s 2025 tariffs reshaped the global trade map.
Biggest hikes hit:
🇧🇷 Brazil
🇨🇳 China
🇷🇺 Russia
Lower tiers for many developing nations, with carve-outs for some partners.
🎥 Made with @plotset → https://t.co/p8i6y0kyM8
⬇️ Get this chart in PNG, SVG, JPG for FREE: https://t.co/LRYdQGxPhS
Source: White House. Imports data from US Census Bureau (2024) Updated 06 Aug 2025
#TradePolicy #Tariffs #GlobalEconomy #PlotSet #DataViz #Geopolitics #GlobalTrade
🫖 vs ☕ Global Sip-Off
Which drink wins worldwide, tea or coffee?
This chart tracks 65 years of data, and by 2024:
🫖 Tea: 336 cups/year
☕ Coffee: 209 cups/year
📊 Made with @plotset → https://t.co/lzhQFWBCQf
🔗 Data Source: https://t.co/pHsQalIU8q
⬇️ Get this chart for FREE: https://t.co/IeZhHi5DIc
#TeaVsCoffee #DataViz #PlotSet #GlobalTrends #CaffeineWars #ConsumerBehavior #AnimatedCharts
📊 Chart’s FREE URL below ⬇️
From 2018 to 2025, one YouTuber took over the internet.
The winner? MrBeast, with 416M subs in 2024 🤯
📉 Watch how the YouTube subscriber war unfolded.
🎥 Made with @plotset → https://t.co/lzhQFWBCQf
⬇️ Get this chart for FREE: https://t.co/5Xebij8Fdi
🔗 Data Source: https://t.co/pZ5veqYvMj
#MrBeast #TSeries #YouTubeStats #SubWars #PlotSet #DataViz #YouTubeGrowth #SocialBlade #Creators