❗️Educational video explaining: ❗️
- Value migration theory
- Using value for understanding market's behavior and placing trades
- Exploiting value areas as dynamic protection levels
This video will help you to comprehend market dynamics on a deeper yet simple level.
Watch, implement and share if you think it can be valuable.
The 60/40 portfolio is a bet on a world that’s already dead.
Most people are SHORT the singularity and don't even know it.
If your wealth depends on human cognitive labor SaaS, consulting, law, finance, admin you're betting AI stays dumb forever.
That bet expires soon.
THE FIRST PRINCIPLE
Value ALWAYS migrates to the bottleneck.
Yesterday: Intelligence was scarce → long education, credentials, cognitive labor
Tomorrow: Intelligence is infinite → long everything intelligence CONSUMES
The bottleneck shifts from THOUGHTS → PHYSICS
THE POST-SCARCITY PORTFOLIO
Bitcoin (40%): When AI fakes any document, voice, and identity, cryptographic proof becomes the last truth anchor. You can't prompt-engineer 21 million.
Energy (30%): Not betting scarcity lasts forever betting ASI gets hungry before it solves its own hunger. Time arbitrage on deployment lag.
Hard Tech (20%): Software copies at light speed. Hardware copies at the speed of concrete. Long the toll booths: fabs, rare earths, data centers.
Cash (10%): The transition will be violent. Liquidity = optionality when the old system breaks.
If ASI goes fast and hard, portfolios are irrelevant anyway.
This is a bet on the transition the window where ASI is undeniable but not yet omnipotent.
THE DEEPEST INSIGHT
Post-singularity, the ultimate scarcity is AGENCY who directs the ASI. Nearly un-investable, except through assets that preserve sovereignty outside the system.
✅ Long Physics
✅ Long Math
❌ Short Labor
The window where ASI is undeniable but underestimated is measured in months.
By the time it's consensus, the trade is gone.
#DYOR
🚨 EDUCATIONAL POSTS
I’m going to compile all my educational posts under this pinned post and will continue adding new ones (or series of them) as and when I publish them.
◽️ Wick Fill Strategy: https://t.co/pjk3RxfyoY
◽️VRVP & FRVP: https://t.co/Ks4an6mtS1
◽️OBs/BBs (Do they really work?) https://t.co/eLhzoiTtKJ
◽️BTC 4 Year Cycle Theory https://t.co/oGRZdBskUR
◽️BTC 4 Year Cycle Theory (Version 2): https://t.co/3L3MXP3by1
🧠 How to Backtest (Properly)
1.Backtesting only works with structure.
If you don’t define criteria, you’re not testing , you’re guessing.
2.Start with the area.
High-probability setups only form in logical zones:
– Market Maker Demand / Supply
– Backed by Wyckoff structure
Strong displacement (bearish → bullish, imbalance, FVG) confirms true intent.
3.Strengthen the zone.
A zone gains validity when:
– It takes liquidity while forming
– It forms a chain (e.g., 4H demand → new 4H demand)
– It sits in extreme premium or discount of the higher-timeframe range
4.Timeframe alignment.
HTF range → extreme area → mid-TF range forms → Wyckoff inside the pocket.
This is where the cleanest trades come froms. Bojan into HTF range high/low.
https://t.co/Asz5CScC0g your criteria list.
Use a point-based system:
– Return inside value area
– SD Flip / DS Flip
– USD dominance alignment
– TOTAL alignment
– SMT divergence (BTC takes low, ETH doesn’t + ETH breaks structure = high weight)
More criteria = higher probability.
6.Scalping structure.
Mid-week ranges + emotional Fibonacci retraces.
Deeper pullback = higher retail fear = better reaction.
7.Backtesting routine.
Same hours every day.
Replay mode.
One bar at a time.
No cheating.
Only enter when your criteria are confirmed.
Log everything.
8.Transition to live conditions.
Two weeks trading without capital.
Then low-size.
Goal: ten trades in a row without breaking your rules.
That proves you have an edge and a repeatable system.
9.Psychology management.
Lose a trade? Stop for the day.
Identify why past overtrading happened.
Build rules to block that behavior.
Your emotional framework must evolve with your technical framework.
https://t.co/baRz2MYv7g your own system.
Nobody can give you rules that fit your psychology.
Backtesting shows what works for you.
Structure + criteria + discipline = consistency.
Books that are actually useful:
• The Best Loser Wins, Tom Hougaard
Pure psychology under pressure. Practical. Brutal. Real.
• Alpha Trading, Laurent Bernut
Institutional mindset, risk math, execution hierarchy. Zero fluff.
• The Art & Science of Technical Analysis, Adam Grimes
Market structure, statistics, context. Deep and underrated.
• The PlayBook / One Good Trade, Mike Bellafiore (SMB Capital)
Real trading decisions, not theory. Great for building a system.
• Techniques of Tape Reading, Vadym Graifer
Old-school but timeless. Understanding intent through price.
• Pit Bull, Marty Schwartz
Not a manual, but one of the best books on discipline and identity.
Conclusion
Just start.
No one will do the work for you.
You’ll feel unproductive at first, like the hours don’t matter, but that’s how every real trader begins.
No starting = no data.
No data = no confidence.
No confidence = no results.
Nothing changes if nothing changes.
Sit down. Open the charts. Start backtesting.
Moneytaur study blueprint 🗺️
The process I used to go from not knowing what an order block is to pulling cash from the crypto markets in under 6 months using @Moneytaur_ concepts.
Proof of performance, past 120 days👇
Start date: 09/03/2025 https://t.co/YFgNq5yJ9N
Requirements:
- A PC/laptop
- Wifi
- A basic understanding of trading. ( What candlesticks are, how to actually place trades , etc )
- A free mind
- Time or the ability to free up time.
Starting:
- Structure and routine
- Stick to that routine + Pre mortem plan.
- Notion / Obsidian setup.
The first thing you need to create is a clear routine moulded around how you intend to approach this very large and complex task. This will not be linear and you will naturally adapt it as you progress but especially in the beginning some resemblance of structure each day is vital.
This is an individual process but it is important to understand from the beginning that this will require a majority of your free time assuming you work a full time Job or study as a student. For me in the beginning this looked like:
- Wake up at 6:30.
- Shower
- Study/work for 1h 45m before leaving for work.
- 09:00 -> 17:00 work
- 17:30 Exercise / Train
- Eat
- 19:00 resume study/work
- 22:30 Start to wind down and get ready to sleep.
It changed several times over the months and especially now I am full time but this is irrelevant, the only thing that matters is sticking with what you choose.
Whatever your own routine may look like, it is important to understand it will inevitably require sacrifice.
---
The next thing once you have established a draft framework of your routine is ensuring you will actually stick to that routine. Something I implemented which I found particularly beneficial was the concept of a Pre-Mortem plan. This involves creating several scenarios of a future in which you have failed and working backwards from each of these to find where it went wrong. Here is a video which explains it fully: https://t.co/QGPyfrgrPK
When I did this I came up with 3 scenarios as well as prevention and cure for each. In the 6 months that followed each scenario presented at some point but I was able to catch them early due to having done this.
The last thing is to not over complicate this, don't hyper focus on systems and loose momentum optimizing each detail. Just ensure you do the fucking work.
I was a little guilty of the above at times, trying to craft the perfect routine. In reality the person who just gets up, drinks too much coffee and works his ass off out performs the workflow perfectionist who visualizes and repeats affirmations, any day of the week.
---
Next you need somewhere to store your notes, journal your trades and build your knowledge.
For me this was Obsidian but I have also used Notion before and it is an equally viable option. Whichever one of these you choose be warned you will inevitably want to bang your head against a wall trying to use them for the first few days, but they will both click pretty quick and are 100% better options the word document or paper alternative.
Here is my full obsidian setup tutorial: https://t.co/7sdsOTQEyE
Here is a link to @studentoffew 's notion Journal: https://t.co/nfFCqFnpsX
Here is how I create "Meta-Notes" using obsidian: https://t.co/WKmYwwWmJu
The process:
- How I did it.
- How I would do it if doing it again.
Now I did things the "hard way" and manually worked my way back through each of MT's tweets starting in 2021, reading every one and logging those that I felt where relevant. You can see in my first post: https://t.co/YFgNq5yJ9N the very first system I used to do this. I quickly adapted though after about a week and focused less on just logging each relevant tweet but trying to find and focusing on those which contained the most information. There where a lot of charts I looked at then skipped over because especially at the start of his timeline they contained little useful information and my time was better spent finding those where there was something to decode. Now this does not mean skip out on "work" just use your time efficiently.
--
If however if I was to start from the beginning again with the goal of levelling up technical understanding as quickly as possible I would take a different approach. To start with I would familiarise myself with all relevant SMC concepts, I have linked the best free recourses for this below 👇
@CryptoChase02 beginner friendly index: https://t.co/j0IDFJzlN1
@barnc0re's "The Moneytaur Way" series: https://t.co/SoHcnsNJcg
@materagian's Trading bootcamp playlist: https://t.co/jdtTOWHEEg
Following this I would then work through all of Taur's subscription posts working backwards, recreating his charts and taking notes on his logic. The subscription feed has the highest value density and least noise.
Video example of my notes from his subscription posts 👇:
---
Okay so now once you have a basic understanding of concepts and can re-recreate them on charts of your own it is time to put this in to practice. The next step is vigorous backtesting, you can use the trading view tool but I think trade Zella offers a more use friendly option if you pay for the subscription. Especially as it allows you to change timeframes without skipping ahead to candle close time of the timeframe you change too ( like Trading view does )
*my only note would be that their LTF/Micro TF data feed with be different to brokerage charts you will use on Trading view, to start with though you should not be going low enough that this is an issue.
When you backtest in this context, treat it like real trading. That means journal and logging like you would if real cash was on the line. Take time, do not rush and focus on quality.
Stick to BTC, ETH, Major FX pairs or indices as these assets are less reliant on confluence, backtesting a shitcoin is near useless as whether levels work or not will be highly dependent on Majors PA. Go on HTF, scroll back a couple years and try not too look at chart while doing so and then begin. Start with HTF analysis and work down to 2H or wherever you feel comfortable, chart it fully and then identify setups. Make rough notes / plans and then press play, execute the setups as they hit, log and journal trade management as well as observations and key notes. It is very important to not cheat when you do this, do not skip back and adjust your stoploss because it hit by 0.1%, do not skip back and adjust plan because you missed a block and your TP got frontrun. Instead these are the things you journal, embrace these mistakes because they are the cheapest mistakes you are going to make.
Grind this, do it for hours, put some music on and enjoy. To start with focus on HTF's, as you get better and start netting $ on paper you can drop the timeframes and increase the difficulty. HTF = Normal, MTF = Medium, LTF = Hard. Even if you do not intend to day trade, learning how to read the lower TF's that force you to think faster, harder and prepare you for lower win rates / loss streaks can greatly improve your ability on higher TF's.
While you are doing this as you start to have concepts click you now want to build up your real trading experience, take a sum of money that you care about but will be okay loosing and dedicate this to live trading. Start taking real trades and expect net losses in the beginning. This is where you will make you 2nd cheapest mistakes. This is also where you can begin to learn about your psychology. You may encounter some elements already in backtesting but the real market is where true colours really start to show.
Mental issues are inevitable and part of the game, get used to them and start working to identify and fix them. Reading and applying books like Trading in the Zone and Mental Game of Trading are important and will help a lot but there is no easy fix, for some stuff you I believe you just have to get used to it and it goes away with experience. Losses suck at the beginning but after you loose 100 times you starting getting pretty numb to it, same goes for the winners.
To accelerate the learning process, build connections and get advice there is also always the option of private groups, while I never personally chose this route and committed to learning everything through my own endeavours there is no denying that having nearly all the information you need structured and compiled in one place is valuable and can save time. Beyond this having access to real time thoughts and opinions of profitable traders can accelerate performance, however it carries the risk of being a double edged sword if not used properly, if relying on it like a crutch and using it as a substitute for real work you will not succeed. With that said if you take it for what it is, a learning opportunity then I believe it can be very beneficial. I am not a member of, nor affiliated with any paid group.
There are now many options available within the community, all run by different people with different styles, tailored to different needs. If I was to make a recommendation though, as a non-member, it would be @Albert_618 & Co's 618'ers simply due to the diversity in styles of the traders running it and results I have seen from members I know personally.
It is important that as you start to trade with real capital you reduce noise in your social feeds or eliminate it all together. You do not need 5 different opinions, you also do not need 2 people telling you the same thing in their own way so you feel re-assured. What you do need is to develop your independent thinking as a trader and be comfortable making different decisions to others, even traders ahead of yourself if it fits with your system or understanding of market. Taur here is perhaps an exception as this is who you are learning from but down the line a real test of your own ability and independence will be being able to stick with your own plan even when it differs from his. Don't get me wrong, counter trading him is retarded but you must learn to adapt his gift to your own style. This will make sense at some point.
The next stage is taking your understanding of specific concepts to higher level as you simultaneously snowball experience. Look back through your journal and review where you lost money and made money, do not over extrapolate from a small sample but start to take notes and observe if trends in performance emerge. This is the beginning of the transition to self reliance, you now understand the strategy but must learn for yourself when and where it works.
Here you can also learn more nuanced secondary concepts such as VSA, orderflow etc and add these to your game where appropriate. Do NOT get lost in the sauce though and remember mastery of basics is key. IMO a big focus should be understanding correlation thoroughly but especially on HTF's this is the most important thing and what triggers the majority of large swings where most of your cash will be made and losses recovered.
Some people will disagree with me here but IMO you should also not be *focusing* on Odd TF's. These are secondary at best and most people overweight their significance leading to avoidable losses while wondering why price did not care about their 327minute Breaker Block which they think is the key to the market. Study Taurs feed and take note of how he mostly uses: 3M, 1M, 3W, 2W, 1W, 5D, 4D, 3D, 2D, 1D, 12H, 8H, 6H, 4H, 2H, 1H, 30m, 15m + micro time frames.
The only thing left is time and repetition, you must show up each day and really do this, for months. Maybe you start to see result's, you catch your first key swing and where able to trade where others froze. Congratulations. Learn from these winners and repeat the actions. Find what assets work best for you, find your style, refine and grow.
---
The last thing I will include is a short list of tools or links that can be helpful.
- Trading view tutorial: https://t.co/YduNlFTYXw
- Dictionary: https://t.co/668NUwodj2
- Market news Calendar: https://t.co/YE22AWAdKt
---
Thank you too all those who have read this, I hope this has been helpful for the beginners who want to start but are just not sure how. 🫶
Don't just bookmark this and move on, start 🙃
⚠️ Liquidity Cheatsheet ⚠️
The Algos that run the markets are programmed
"To go after liquidity levels, to respect fibs, to close imbalances, (...)" -@Moneytaur_
I will explain how to find those liquidity levels:
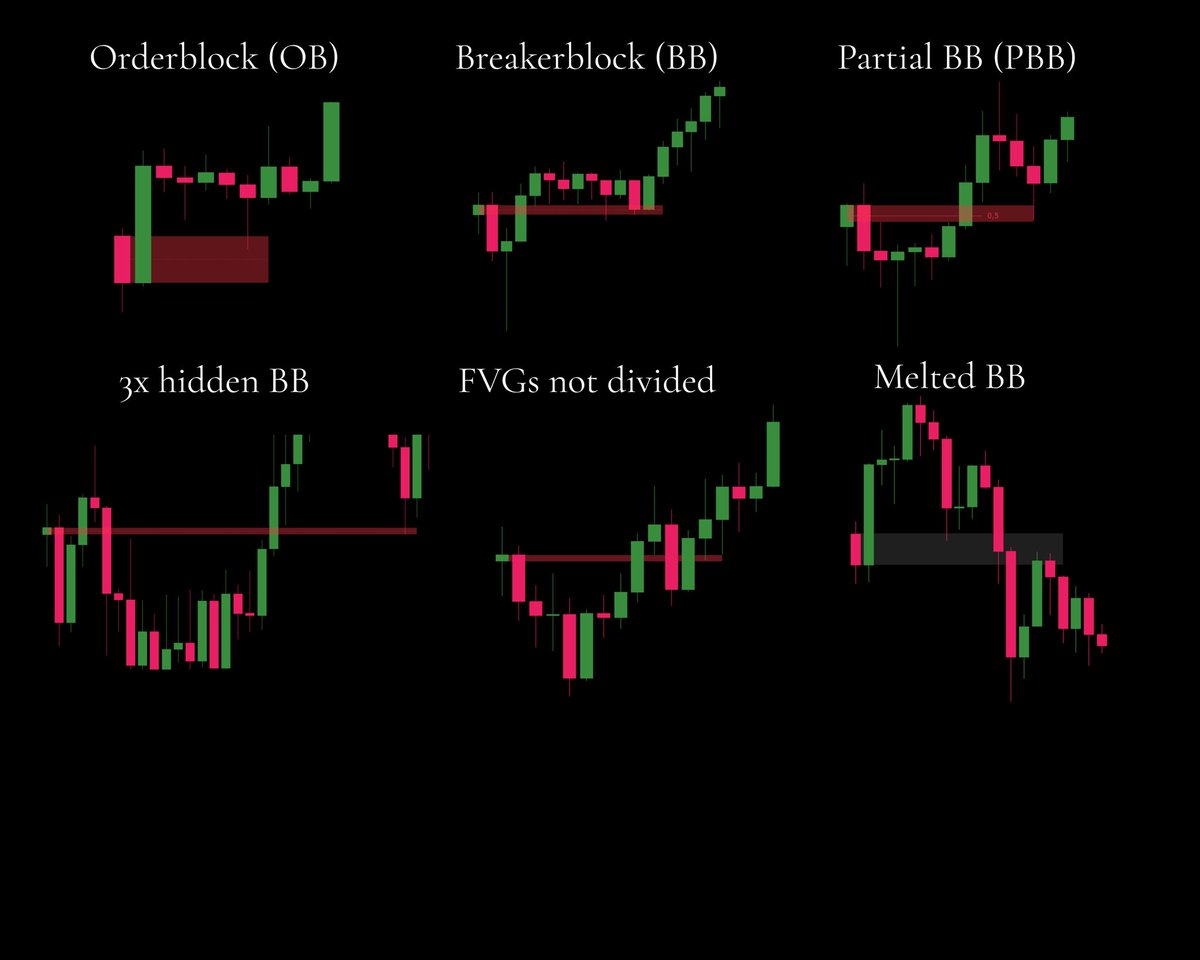
🔹Image 1: Liquidity Blocks
Order Block (OB) = Candle + Larger Candle (opposite color)
Breaker Block (BB) = Order Block fully hidden behind a FVG (see Image 2 for FVG explanation).
The more hidden it is (behind more FVGs), the more powerful it becomes. And the higher the timeframe, the more powerful it is.
Partial BB: If the Order Block was wicked into, narrow it down to the unwicked portion. It’s only valid if the equilibrium (EQ=0,5 fib) of the OB wasn’t taken.
Undivided FVGs are weaker, but they can still be used.
Melted Breaker Blocks (BBs) are the weakest.
A Breaker is stronger when price moves quickly through it. For example, a 1D Breaker Block (BB) with a 12H wick inside isn’t fully untouched as it would appear on the 1D timeframe.
But if the Breaker Block is ignored even on lower time frames through FVGs, it becomes much stronger because its liquidity remains fully intact.
That’s also why refinement works, it reveals the untouched areas on lower timeframes.
For better entries, you want to see a Break of Structure and a retracement into those liquidity levels.
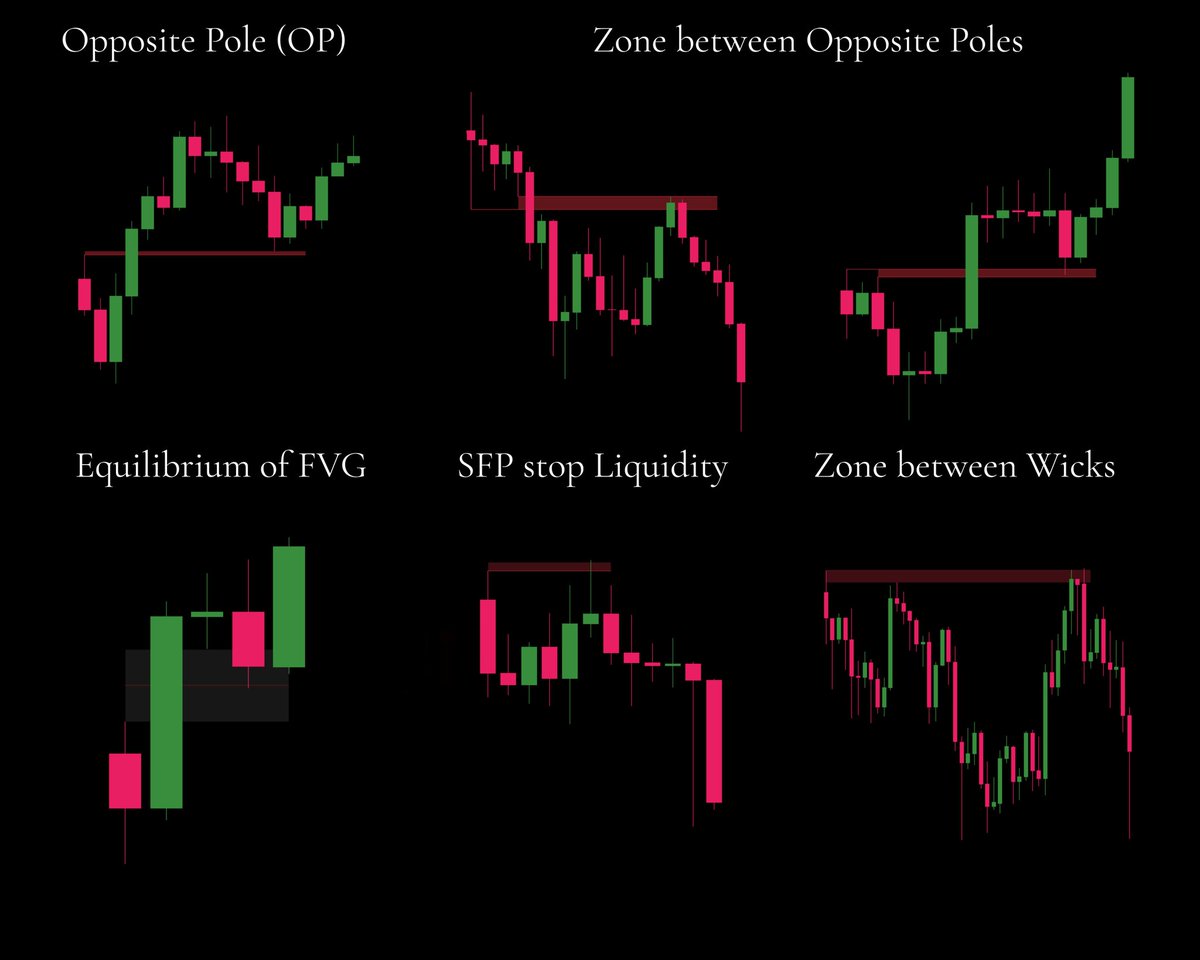
🔹Image 2: Wicks
FVG = Grey Zone
3-candle pattern: One large candle between two candles with wicks. The zone between those wicks is the Fair Value Gap.
The EQ of an FVG can act as an important confluence since algorithms often use it.
Opposite Poles are wicks located behind an FVG. You can use a single pole and the zone above/below it, or the area between two poles.
Wicks (Swing High/Low):
The majority of stops are usually located above swing highs or below swing lows. These stops provide liquidity before market makers reverse price. (SFP=Swing Failure Pattern)
The zone between wicks marks an area where price action could execute an SFP on the nearby swing high or low.
An SFP of the major swing high is possible, though price might front-run the most obvious wick.
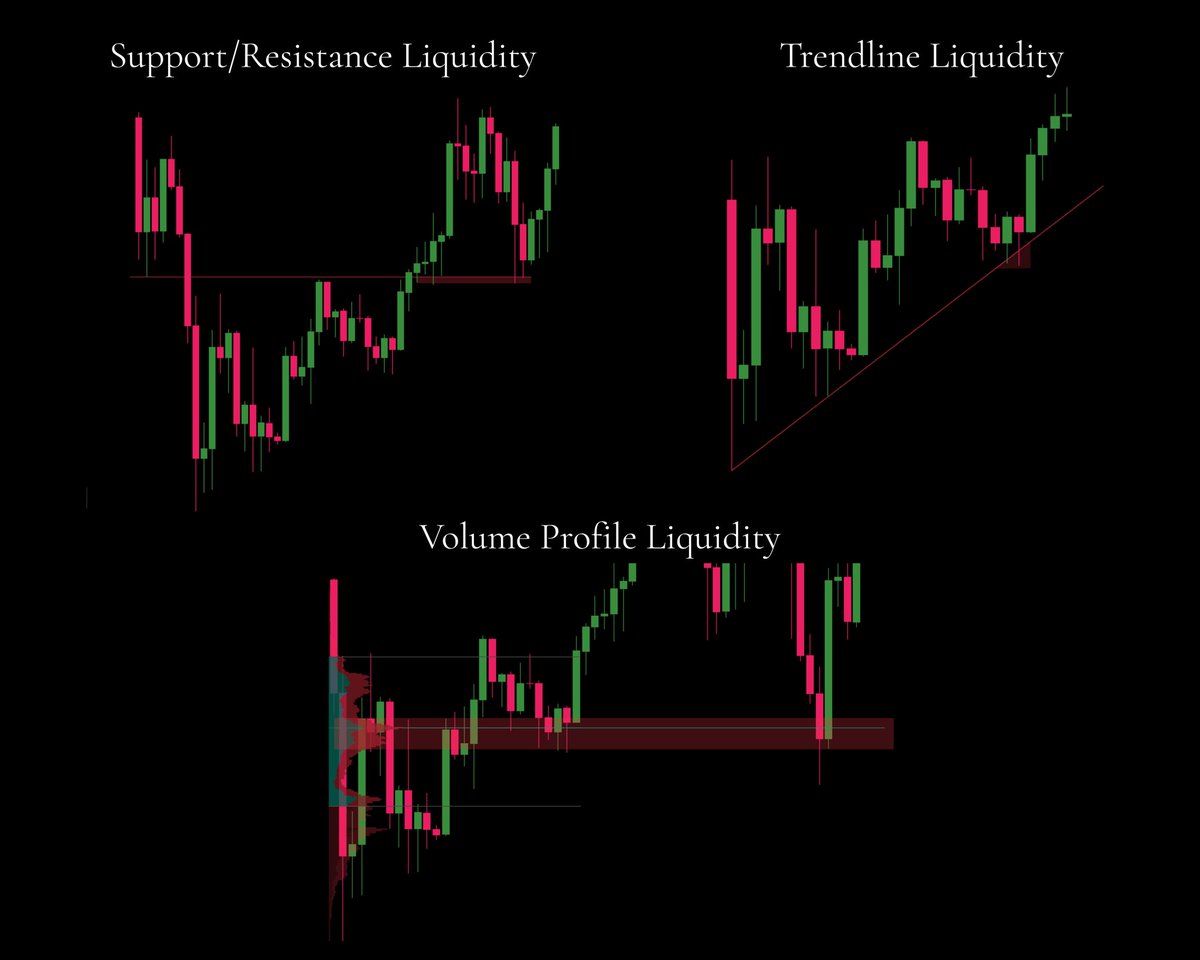
🔹Image 3: S&R, TL, VP
Support and Resistance offer liquidity because retail traders commonly use these levels.
Market makers identify liquidity or stop clusters below support and above resistance, similar to how they view trendlines.
The Volume Profile shows where most positions were opened. These areas often contain breakeven stops or intentions to exit at breakeven, making them zones that provide counterparty Liquidity for MMs.
Value Area Highs (VAH) and Value Area Lows (VAL) are also important levels.
If price fails to trade outside these levels, aka as a failed auction, it often returns back into the value area.
"Once you see it, you can’t unsee it." -MT
You need to over-connect the dots right now.
T7 not a meme, not a signal, a law of rhythm.
7 days after a major event, the market rebalances.
Look back.
Every big crypto event pumps into hype, reversals after.
Sometimes a dump before, then the reversal on T7.
It’s all timing.
Gun time, energy cycle, liquidity rotation same pattern, every time.
Singapore Grand Prix → 7 days of dopamine.
Markets pumping.
People partying.
Talking new OTCs, private groups, “alpha.”
Then CZ walks out of the shadows “keep building.”
Retail gets hypnotized.
But the Wyckoff in the dark already confirmed.
The smart ones were already short, 5% risk, max conviction.
They just ate steak and watched it unfold.
Because this game doesn’t change.
Market makers print on engineered events.
They hedge every side.
They trigger your dopamine, make you feel something.
then flip the book on you.
You can trade with them,
if you stop reacting and start decoding.
When the herd is convinced,
reverse psychology takes over.
It’s not luck. It’s pattern recognition.
It’s work.
And yes hard work always pays off.
Maybe not today, maybe not tomorrow
but in the end, it always does.
You got this ❤️
The 'heavy market activity' you saw wasn't retail panic. It was whales selling, again.
Retail doesn't sell. They're trapped in analysis-paralysis, sitting on losses, waiting for miracles.
Retail is divided, fighting each other, blaming influencers, governments, charts, or astrology, everything but themselves. Even if they united, they don't have the firepower to move markets like today. Whales do, and they move together.
They create both sides of the story. The side of hope and the side of despair, while retail argues over which side is "right"
Every pump is engineered greed.
Every crash is engineered fear.
Both are liquidity traps.
Whales keep building on steroids because the herd refuses to stop gambling in a system designed to drain them. The game is, and always will be, a scam designed to extract from the majority. There's no future here if you play the game like everyone else.
👁️Many people have asked me: 👁️
“Mate, what’s your strategy? How do you actually trade the market and which tips can you give me?"
Today, I want to share my approach with you and not just the mechanics, but the mindset, the discipline, and the long-term vision that are often overlooked. (I believe this can help you if you're struggling)
The truth is, trading isn’t just about techniques or spotting levels.
It’s about psychology, discipline, and clarity.
Life already pressures us with work, deadlines, family, and constant notifications.
Why should we turn trading into another source of anxiety?
Many people chase excitement in the market, seeking adrenaline, fear, or euphoria.
I seek the opposite, therefore calm, coherence, and simplicity as profit doesn’t come from tension, but it comes from staying still while the market moves around you.
My goal is to build a clear, repeatable, and sustainable approach that doesn’t add stress to an already busy life.
You already know I rely mainly on SMC so I won’t get into explaining them.
Now everyone can spot levels with some practice, but the real edge comes from contextualizing them, understanding why certain order blocks work while others don’t, and being able to interpret accumulation, distribution, and other complex market dynamics.
It's crystal clear that execution is where many traders make mistakes.
Often, it’s not analysis that fails, but timing.
Prices often approach key levels, absorb liquidity, and only afterward move in the intended direction forcing early entries to get stopped out.
Waiting for confirmations? Absolutely, it increases the probability of success, even if it occasionally skews the risk/reward ratio.
However, there are two main ways to execute trades: high leverage and low leverage.
After years of experience, I’ve chosen the second path, but why?
Because it allows me to give the market time to form reliable structures, manage my risk effectively, and trade calmly and clearly without unnecessary stress.
-----------------------------
Psychological connotation 🧠
-----------------------------
Yes, I know what you're thinking: "I scroll social media and I see plenty of people flexing 100xs longs/shorts and this forces me to think I'm not enough"
I get it.
Every time you open Instagram or TikTok, there’s someone showing off their massive wins, their luxurious lifestyle, their fast gains and it’s easy to fall into the trap of comparison, to start thinking that slow, steady growth isn’t exciting enough, that your discipline isn’t “doing enough.”
Social media is a highlight reel, not reality.
You’re only seeing the wins, the celebrations, the moments that make for clicks and likes.
Rarely do you see the drawdowns, the stress, the emotional battles, or the countless trades that didn’t work out.
Comparing yourself to curated 📷snapshots is a psychological trap.
It can push traders toward reckless decisions, over-leveraging, or chasing trades for the thrill, just to feel like they “measure up.”
The truth is, calm, disciplined, consistent trading doesn’t make for flashy Instagram stories, but it builds real, sustainable wealth.
You don’t need to impress anyone online.
The real victory isn’t in showing off a 100x trade, it’s sticking to your method, following your plan, and letting compounding work quietly and steadily over time.
The people who scream the loudest on social media are not necessarily the ones winning in the long run, they’re the ones who make the market look exciting while masking the real risk behind it.
My mantra is simple: plan, execute, and profit (hopefully)
Behind these 3 words lies a precise methodology.
Planning means analyzing HTF for key levels, identifying liquidity zones, contextualizing them, and defining invalidation points where a trade idea no longer makes sense.
My execution often happens on the same timeframe of the level I'm trading (waiting for closures within the level), but I also look into MTF where I confirm operational signals such as accumulation, BBs, or FVGs completion.
Risk management is essential.
My stop loss is always at the invalidation level, never arbitrary.
Position size is based on the risk per trade, and I never average down or improvise.
❗️Trade management is equally important ❗️
I move my stop to breakeven when a trade moves in my favor, take partial profits at key levels, and let the remainder run to maximize potential moves.
For instance, if price rebounds from an order block and breaks a supply, I start to trail below that supply that has now became a breaker, letting the rest ride toward the next liquidity area.
Compounding and leverage are where long-term growth truly shines, in my opinion.
Many people think success comes from big wins using high leverage and while this can be a great integration (open low lev/when in profit trail/remove the margin/increase the leverage) what I prefer is a slow, consistent progress.
----------------------------------
👁️Example
---------------------------------
Imagine two traders, both starting with 10K.
Trader A decides to risk 1% of their account on each trade, aiming for a 2:1 reward-to-risk ratio.
That means for every $100 risked, they aim to make $200.
After 50 trades with a 50% win rate, their account grows steadily to around €12,800.
After 100 trades, it reaches approximately $16,400.
His growth is gradual, almost unnoticeable day to day, but remarkably consistent.
Even a string of losses doesn’t shake his account significantly as he can keep trading calmly, stick to his plan, and let compounding work in their favor over months and years.
Now consider Trader B.
Trader B decides to take bigger risks, 5% of their account per trade, with the same 2:1 reward-to-risk ratio.
That seems exciting because the potential gains are enormous.
One winning trade could make $1,000, 10 times more than Trader A’s typical win.
After 50 trades with the same 50% win rate, the account has the potential to reach $34,000.
After 100 trades, it could surpass $100,000.
Sounds incredible, right? But the problem here is that high leverage comes with high stress.
Just imagine if Trader B hits 10 consecutive losses, which is not unlikely.
That would wipe out 40% of their account in a very short period.
Emotionally, he's riding a rollercoaster made of fear, frustration, and desperation creep in, and his decision-making suffers.
One bad reaction could undo weeks or months of progress.
The key takeaway is that compounding only works if you remain disciplined over years.
Leverage can amplify gains, but it also amplifies psychological pressure.
So, I keep it simple where the majority of my trades are made with bigger size and lower leverage as I can clearly manage them understanding if the price is invalidating my setups or not, looking for a powerful compounding over months/years.
Trading is complex enough already and I don't want to make it harder.
I aim to reduce stress, maintain clarity, and trade with discipline. I don’t chase tomorrow’s big win. I focus on building today so I can reap rewards in the years ahead with this extra business.
I believe that true victory isn’t a single profitable trade but it’s sticking to your method consistently, even when the market tests you.
This is how I trade.
🧵 Every Price Action Is Either an Accumulation or Distribution
If you can read this, you’ll never see charts the same again.
Here’s how to identify range breaks, hidden distributions, and when Wyckoff is actually needed (or not):
1.
Price is always accumulating or distributing.
Every trend leg, every pullback, every box either:
• Absorbing supply (accumulation)
• Shedding risk (distribution)
There’s no neutral. Smart money is always positioning.
2.
So do you always need a textbook Wyckoff schematic?
❌ No.
Wyckoff only appears when a true reversal is engineered.
That requires:
• Time
• Liquidity
• Trapped traders
• Visual cues for the masses
Market makers need that only when they flip bias.
3.
A trending leg = one big accumulation or distribution.
If it trends up, all blocks & structure are accumulation until proven otherwise.
The reversal won’t happen from just another “supply zone”. It happens when the dominant intention shifts to distribution.
4.
How do we know when that shift starts?
Simple:
✅ Identify the highest timeframe possible where the range is valid
✅ Use the 6-candle rule to define valid structure
✅ Use the DL range deviation tool
(Visual below ⬇️)
5.
The 6-Candle Rule (quick version):
To form a valid bullish structure leg:
• 2 bullish candles higher than each other
• 2 bearish candles lower than each other
• 2 bullish candles higher again
This confirms clear intention & anchors your valid range.
6.
Once the range is valid…
Turn on DL settings (from the Fibonacci tool):
📸 See attached image for visual settings.
Now you’ve got your deviation levels for the range.
7.
How do you confirm a range break?
If price closes outside DL
(on the same high timeframe that formed the range)
→ That’s a range break
→ The Wyckoff window is invalid
→ We’re no longer anticipating reversal structure
8.
Instead, you now look for:
• Range mitigation setups
• Expansion plays
• Re-accumulation or redistribution patterns
No more waiting for SOS/UTAD/etc.
The intention is already shown via structure + DL2 close.
9.
So to wrap it:
→ Not every accumulation/distribution needs Wyckoff
→ Wyckoff only appears if price is going to reverse direction
→ Use the 6-candle rule to validate your range
→ Use DL to know when intention shifts
🧠 Follow the rules. Don’t guess
Stay sharp. These are the rules.
Yo @grok please compare the (global) debt based fiat monetary system and BITCOIN, and analyze which of the two is more likely to be a ponzi scheme, based on its characteristics. Include reasoning as to why or why not, and a probability percentage.
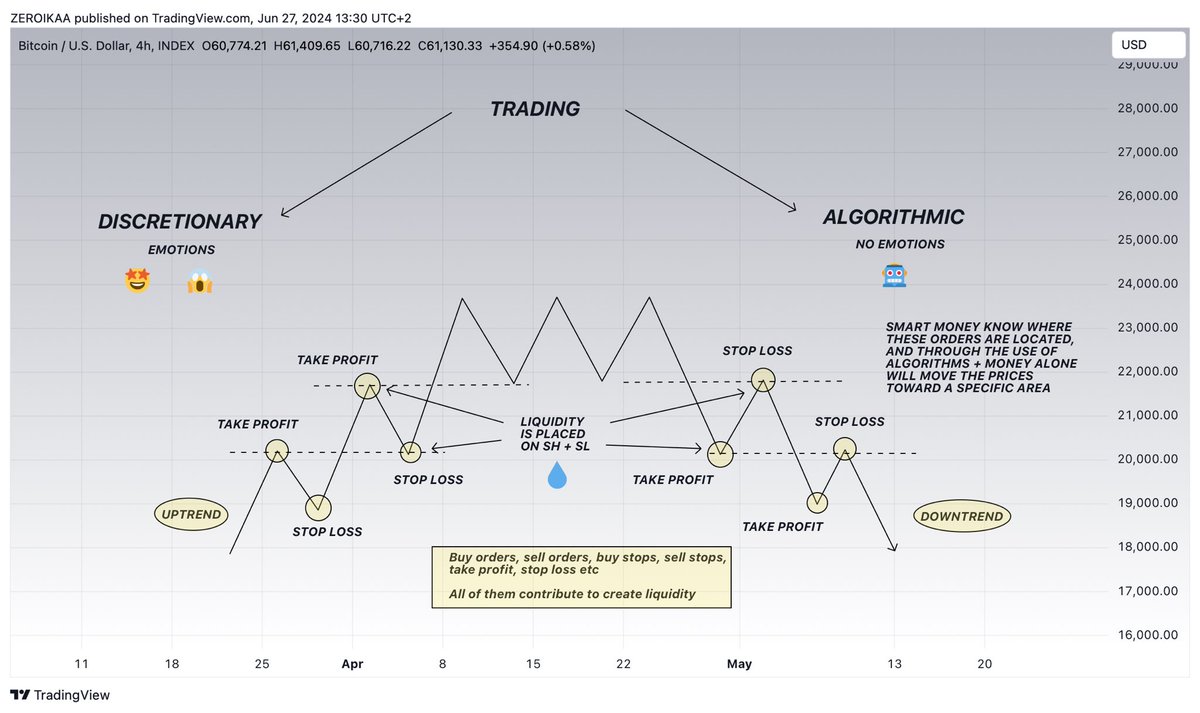
Another write-up to make you understand how liquidity 💧works. (there’s a lot more but this is a great start)
Pay attention.
As we know, liquidity comes from trading and this can be done in 2 ways:
• Discretionary
• Algorithmic
The first way is the one used by all of us, retails, which includes a big emotional component that can lead to bad financial decisions.
The second one instead, is the one utilized by institutions and hedge funds aka smart money which removes the emotional sphere since it’s executed based on pure data, statistics, and bots.
Let’s start by saying that most discretionary traders and also algorithmic ones operate with a “breakout strategy”.💥
What does this mean?
In a “trend-following” strategy hypothesizing that the trend is bullish, a trader expects the price to break the previous highs since the trend continues to form HHs and HLs.
When the price finally forms another high, a trader waits for confirmations given by HTF closures and then enters the position (usually with buy stops) expecting a new bullish impulse.
At the same time, there are traders who wait for a trend reversal and therefore, contrary to the first ones, place their orders expecting a turnaround of the predominant trend.
Whether it’s an uptrend or a downtrend, orders will be thus placed at the highs or the lows, and this can include all types: buy orders, sell orders, buy stops, sell stops, stop loss, take profit etc.
Orders contain traders' money independently of the buy/sell operation, aka..liquidity. 💧
The 🔑 and crucial difference between us and smart money is that they know where orders are located since SM exchange information between them + monitor the order flow + heavily invest in trading algorithms.
The more a level contains multiple orders, the more liquidity will be agglomerated and the more interest smart money will have in reaching that zone.
“Reaching that zone? Is this a conspiracy theory?”
Believe it or not, SM have the power to control the price (since they have truckloads of money) and they collaborate with each other to bring the price toward specific points.
That's how sharks 🦈 eat small fishes 🎏, by consuming their orders through liquidity sweeps.
Liquidity grabs (wicks) are in fact market makers' manipulations in order to eat that 💧that very often is used to reverse the price.
That's also why it’s important to always look for HTF closures above 🔑 SHs and SLs in order to gauge continuation/rejection, therefore not blooding 🩸.
Study liquidity, study smart money.
Many people ask me: "Mate, how do you chart? How is the process if I want to start from a naked chart?"
Time to drop the whole framework with the hope that you may find interesting ideas to apply to your journey.
Disclaimer: Before starting, it's important to remind that everyone has his own style and the crucial aspect is being able to find a methodology that offers the highest statistical probability over time, aka backtest, contextualized to goals/time horizons and time that an individual can commit.
(Quite long post, so if you're lazy "TLDR" skip it, this isn't for you -> but if you're drinking a Mojito 🍹on the beach, you have time to read)
- First step -
The first thing way before everything else is understanding the macro structure in order to have a clear view where the price is trending and thus being able to work on a strategy.
To do so I'm gonna directly switch the chart to HTFs, mainly weekly and daily which are my favorite TFs (monthly also, but after having made a "first touch-analysis") as they have more relevance than LTFs, of course.
From those TFs, the process is identifying:
- HHs/HLs for the bullish trend
- LHs/LLs for the bearish trend
Nothing difficult, this is the first and necessary step that leads to build up the main strategy.
- Second step -
Now that I know if the price is in a bearish or a bullish trend, I start to identify strong supply & demand areas where the price can be rejected or bounce.
S&D zones are more powerful than support and resistance levels as they provide wider areas, but this doesn't mean that S/R should be ignored but instead utilized as "2nd layer" once you grasped the bigger picture.
There are S&D zones that are stronger than other ones and they usually match historical and significant points in which the price has violently wicked or strongly rejected/bounced.
Take note as additional info that the more a S or D zone is touched, the weaker it becomes as orders on one side or another get absorbed -> this can change your overall perception and operational activities.
S&D zones together with S/R levels contribute to create the "main dish" which is completed by the "dessert" called Order Blocks.
OBs are zones where significant buying or selling from smart money, offering extra but valuable areas in which the price can reverse.
Bearish and bullish OBs can fail, there are no certainties, but being to properly contextualize them in an overall analysis can make a huge difference leading to profitability.
Not every OB plotted on the chart has the same relevance, most of them are weaker as they have already been tested multiple times, therefore increasing the likelihood of being melted like butter.
The process of finding good OBs doesn't only depend on looking at HTF ones, but also switching to multiple timeframes in order to find the best ones.
Weekly? Yes. Daily? Yes. But very often you can find good levels by switching to uncommon TFs like 2D/3D as there's liquidity contained in candles that are invisible to classic TFs.
Identifying and drawing these areas on a chart adds more clarity which is strengthened by the application of trendlines.
Trendlines are drew by taking into consideration at least 2 SHs/SLs but for my attitude 3 is the perfect number that validates a correct TL.
The 🔑aspect here is to not force a TL (don't chain yourself in finding one if conditions aren't met) + understanding that horizontal S/R are more powerful than diagonal ones.
- Third step -
Finding the liquidity.💧
This is one of the most important steps as everything turns around the concept of liquidity (more here if you're interested -> https://t.co/AIibrw2QM0)
Fair value gaps play an important role in my strategy, especially the ones who have never been tested, thus boosting the probabilities of seeing the price catching the liquidity 💧toward those areas.
Untested ones that find confluence with historical PA (especially areas in which the price has strongly reacted) are more powerful than "naked FVGs" that have less relevance.
As per the OBs, even FVGs might be evaluated on multiple TFs to find the best ones, meaning that if you find multiple confluences, those gaps become stronger.
In a strong trend, FVGs could act as supports if the body of the candle closes inside of them or the price wicks toward those areas, leading to continuation.
As a general rule, I tend to look for HTF FVGs in opposition of the trend meaning that, if we consider a reversal, the higher ones in a bearish trend and the lower ones in a bullish trend, will likely be more powerful contributing to attract the price over time.
FVGs alone don't tell you about the liquidity, they need to be contextualized to candle bodies in order to be effective.
- Fourth step -
The study of price action.
Once the chart starts to appear clearer as it incorporates the concepts we mentioned above, I start to monitor all the factors involved in the PA.
This includes:
- The candles (big or small bodies and when they appear)
- The wicks (where they spike and how long they are)
- Momentum & Dominance
- Closures above/below significant areas or SHs/SLs
The dominance is extremely tied to the concept of S&D, with SHs/SLs as points to overcome in order to see continuation/reversal.
Momentum, instead, refers to the "speed" of sellers and buyers.
The less it takes for a price to reach a specific level, the stronger the momentum from buyers or sellers.
The more it takes, the weaker the momentum for one side or another.
When the price closes HTF above SHs/SLs I know that could be a trigger for future continuation, usually preceded by a pullback, it's not "an instant shot".
I know, there are dozens of candle types (marubozu, hammer, hanging man, etc) and they surely help, but I prefer to move my focus on the bodies and on the wicks, as they can be enough to understand what is happening/about to happen.
Patterns?
Yes, the ones that have the highest probabilities like H&S/IH&S + 3 drives + ABCD correction.
Triangles? Sometimes, but more specifically to see if the price is compressing and can lead to a breakout.
- Fifth step -
Adding Fibonacci retracements.
I apply them on a macro scale and on HTFs, both to calculate retracements and potential targets for the future.
I use them also on lower timeframes as they help me to calculate small retracements on uptrends and assess where I could potentially take profits and reload lower.
Areas of interest are usually 0.786 + 0.618 + 0.5 (equilibrium), both for uptrends and downtrends especially if they match with S&D zones or FVGs as they become more powerful.
Extensions to calculate targets are another crucial part of my strategy, with the area of 1.618 + 1.454 + 1.272 that often helps me to find amazing 🎯
- Sixth step -
Finding confluences with external "noise" like news or announcements as they often happen when the price reaches a significant 🔑level.
Bullish news +🔑 HTF upside level -> sell
Bearish news + 🔑 HTF downside level -> buy
Price action always moves first, then the news comes out to "justify" the impulse and to 🪤 retails.
- Seventh step -
The add of potential indicators.
I don't use common indicators if not the Volume Profile that helps me to spot volume voids that matched with gaps contribute to attract the price or see areas in which there was substantial trading activity.
I often utilize Velodata for OI, Funding rate, CVD spot volume, Premium & Perp which help me to sustain the main thesis led from the price action alone.
The other indicators, for my strategy/idea aren't helpful.
That's basically the whole framework of my strategy and how I setup my charts.
If you found this helpful, the like 👍and repost buttons are just few centimeters below.
Live your life like you're the hero in your movie, and right now, pretend that you're in the part of the movie where it shows you're a loser (very beginning)
Many are struggling financially, but still look for time wasting activities. I'm talking about those who complain about their job, got no money, but are still procrastinating.
An idea doesn't execute itself.
A book doesn't write itself.
The weights in the gym aren't going to move themselves. You have to do it, and you have to do it while you still have time. Don't forget everyone's clock is ticking. Use your time to make great things happen, for you and those around you.
"If you're lazy, I don't want to talk to you. You're going to make me feel dumber. You would lower my level" - Kobe Bryant
The reason why people are so lazy is not because they don't have the ability. They're lazy because they fear everything and they dream too small.
No one's perfect.
Everyone makes mistakes.
Everyone fails,
but only lazy people stay grounded until they die.
They say things like:
"I'll start Monday!",
"It's not my fault!",
"It's not fair!",
"I'm too tired!",
"Those rich people are just lucky!",
Or the best of all:
"I don't have enough time!", despite every human being having 24h/day, every single day.
They have a loser mentality, and until they recognize that the problem is them, they'll never improve.
You will be tested, and how you face that test, and how you overcome that test, determines the rest of your life. Your life comes down to your decisions, and if you change your decisions you will change everything.
Procrastination will assassinate your motivation, and without motivation...how can you reach your destination?
Lazy doesn't qualify for greatness. Laziness makes you weak, and other people will outperform you easily.
"Where do i start?"
"When is the best time to start?"
- Here. Now.
"While the sun is still shining on your face rather than on your grave, you can still make great things happen" - Coach Pain
Believe in yourself. Remember that every winner was once a loser, and every teacher was once a student. Successful people are ahead of you because they've put in the work you didn't.
Don't leave anything for tomorrow, because you don't know if tomorrow will ever come.
You can study my theory.
You can learn my technical analysis.
But you can’t replicate my critical thinking, my pattern recognition, or my ability to cut through noise as those are products of my own journey. They’re earned, not taught.
However, you can commit to self-mastery. And with enough time, discipline, and clarity, your mind might evolve to see what i see. Only a microscopic fraction can operate at this level, but it’s not unreachable.
If you feel that potential inside you, don’t ignore it. Pursue it. Because even if you never fully match my vision, you’ll still end up sharper, wiser, and wealthier a decade from now.
Because when you choose to level up, you can’t lose. The only ceiling is the one you set, so raise it higher than you think is possible.
That’s the beauty of life: Your limits are negotiable. The boundaries you believe in are often illusions shaped by fear, past failures, or other people’s opinions.
You can renegotiate them.
You can rewrite the contract.
The ceiling you’re living under was likely never real. It was just a mental agreement you made without knowing it.
Question it. Push it. Break it.
I’ve lived both sides. I know what it’s like to be broke and i know what it’s like to be wealthy. And trust me, the difference isn’t just financial.
So take the message.
Absorb the truth.
And go level up.