JUST IN: $14 trillion BlackRock's iShares Preferred and Income Securities ETF has increased its position in Strategy's $STRC, $STRF, $STRK, and $STRD preferred shares by $7 million, bringing its total holdings to $656 million.
That's 4.94% of the total ETF. 🔥🚀
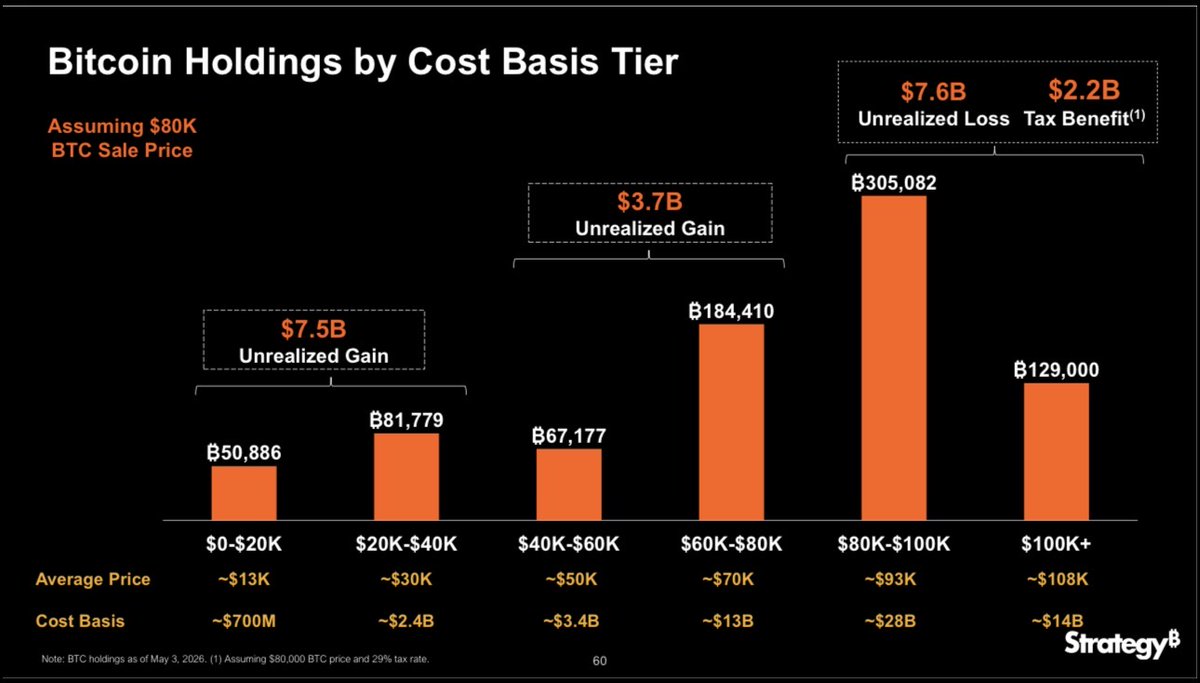
Strategy probably sold much higher cost Bitcoin since
Bitcoin Average cost fell from $75,578 → $75,476
The 8-K did not disclose the purchase price of the Bitcoin sold. I would expect this slide to be updated in the Q2 2026 presentation.
It’s surprising and honestly TOTALLY SHOCKING, but S&P/credit markets may care less about religious purity and more about demonstrated liquidity, payment discipline, and willingness to use the reserve asset as an actual reserve asset.
“Strategy is forced liquidating the stack.”
This will be the narrative from the sub-70 IQ people.
It is them proving the capital structure can monetize a small piece of BTC liquidity to keep the preferred machine current.
Ignore all FUD nonsense.
Mark your charts up, please.
Next ‘Eclipse Season’ window:
Begins on July 24th & Ends on September 1st
The solar eclipse on August 12, 2026 occurs when the new Moon is at/very near the Moon’s descending node. This marks the approximate moment the Sun passes the node.
Astronomical definitions of an eclipse season are the period when the Sun is within the “eclipse zone” (roughly ±17–19° of a lunar node). Because the Sun moves about 1° per day:
• The season typically starts ~19 days before the nodal passage → July 24, 2026
• It ends ~19 days after the nodal passage → August 31, 2026
Your proposed window (July 24 → September 1) is essentially the same, just rounded by one day at the end. That’s perfectly reasonable for practical use (trading, Gann analysis, lunar cycle work, etc.).
Refined Best Estimate
• Most precise window: July 24 – August 31, 2026 (≈ 38–39 days inclusive)
• This comfortably contains both eclipses:
• Total Solar Eclipse → August 12
• Partial Lunar Eclipse → August 27–28
This length matches the standard astronomical range for eclipse seasons (usually quoted as 31–37 days, sometimes up to ~38–39 days depending on the exact angular limits used).
Official Eclipse Dates (Confirmed Across NASA, Timeanddate, Wikipedia, and Other Astronomical Sources)
• Total Solar Eclipse: August 12, 2026 Greatest eclipse at approximately 17:47 UTC (partial phase begins ~15:34 UTC and ends ~19:58 UTC). Totality path: Arctic, Greenland, Iceland, northern Spain (and a small part of Portugal). Partial visibility across much of Europe, northern/western Africa, and parts of North America (including northern U.S. and Canada). https://t.co/FnBS5i8Jo0
• Partial Lunar Eclipse: August 27–28, 2026 (spans the night of the 27th into the early hours of the 28th UTC) Greatest eclipse at approximately 04:13–04:14 UTC on August 28. Penumbral begins ~01:24 UTC Aug 28; partial phase ~02:34–05:52 UTC; full event ends ~07:02 UTC. Visible across the Americas, Europe, Africa, and parts of the Atlantic/Pacific. It is a deep partial (umbral magnitude ~0.93, with ~93% of the Moon in Earth’s umbra at maximum). https://t.co/sktdMzNgwy
These match the annotations on your TradingView chart exactly (Total Solar Eclipse Aug 12th and Partial Lunar Eclipse Aug 28th, with lunar phases marked).
Official Length and Definition of an Eclipse Season
An eclipse season is the ~34–35 day period (typically 31–37 days) when the Sun is close enough to one of the Moon’s orbital nodes for eclipses to be possible at new moon (solar) or full moon (lunar). https://t.co/FICDXkreVv
• It recurs roughly every 173 days (slightly less than 6 months).
• The Sun moves ~1° per day along the ecliptic and crosses a ~34° “eclipse zone” centered on each node, taking about 34.5 days. Eclipses can only occur during this window.
Are you thinking what I’m thinking here?
Bitcoin’s price into Solar Eclipse ?
price at end of Eclipse Season?
price on Oct. 4th thru 10th?
You make the call. …then, the put
(purely speculating)
This is bigger than it looks.
The Major County Sheriffs of America, representing more than 120 million Americans, just shifted from opposing the CLARITY Act to neutral.
Their opposition was one of the biggest roadblocks in the Senate, reinforcing law enforcement concerns and stalling momentum.
With that hurdle now out of the way, the path to passage just got a lot clearer.
One more major hurdle down.
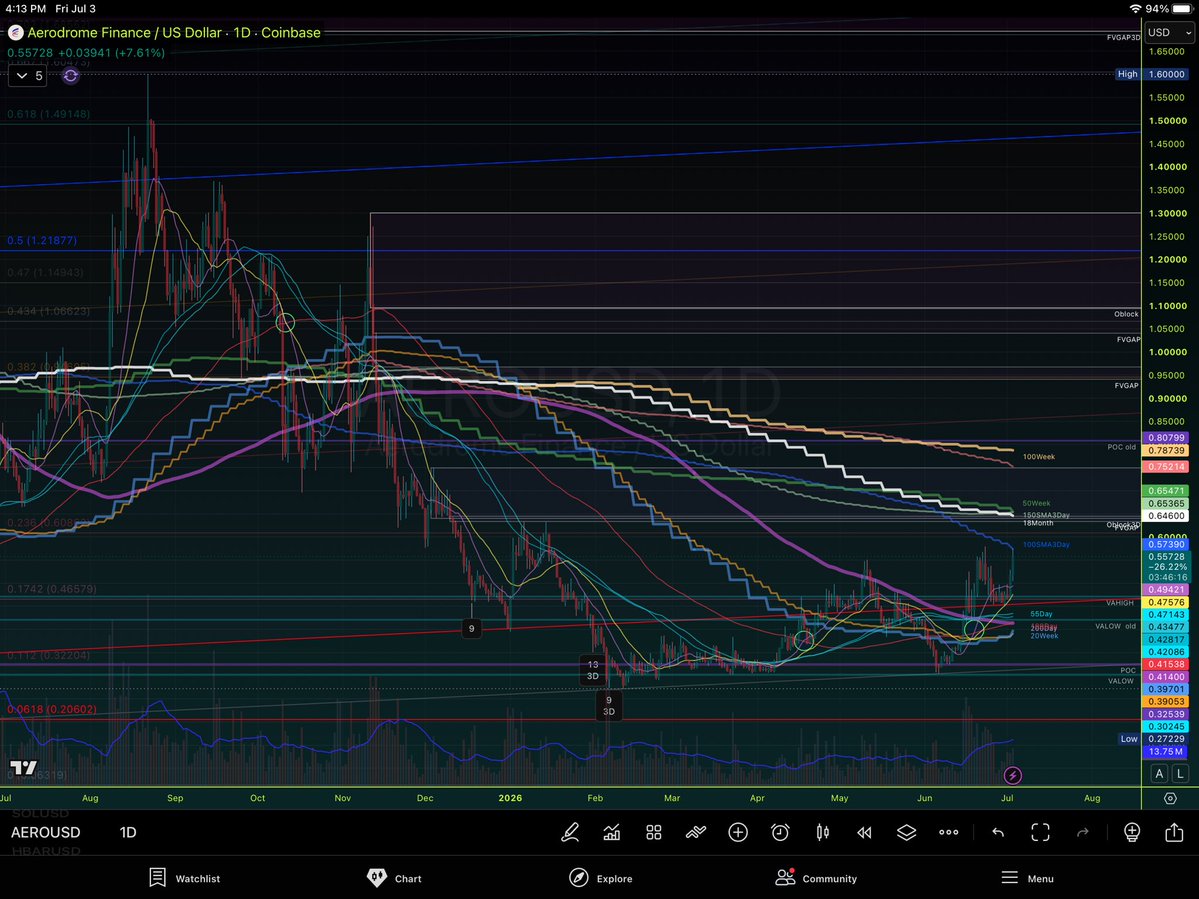
Been following AERO since introduction. It is (until fundamentals change) one of a few projects that serve as a barometer of health for rest of the market, imo. The 12 x 100 Day bullish cross has recurred…running well ahead of BTC & ETH. These 12 x 100 Day crosses often occur once, but can occur 2 or 3 times at the bottom of ranges, historically. ETH has double-bottomed at the 500Week. Not sure, so what do you think? Y’all think we need ETH to go another leg lower, still? I’ve seen some very technical-looking Elliott Wave plotting as of late 🤷🏻
It cracks me up as to how much open interest is a focus on a daily basis, & the market makers just kept blowing out the long positions over the past (almost) **12 months**
coinbase buying veAERO on open market at full retail price to control liquidity emissions on base. aerodrome processes 51% of base DEX volume, $70b+ annually on $400m TVL. the aero/velodrome merger executes this month, extending that governance to ethereum mainnet and circle's arc chain simultaneously. one governance token controlling liquidity allocation across three chains. coinbase is building exchange to L2 to privacy layer to DEX governance as a single vertical stack. no other entity has this depth of control over the onchain finance pipeline. the merger window closes in july and every veAERO locked for 4 years removes circulating supply permanently. think about how much a choke point on $70b in annual volume is worth. it's worth more than that.
$MSTR +11.56%, $STRC +3.70%, $STRD +5.91% $STRK +4.70%, $STRF +2.03%, $BTC +1.86%
Looks like the folks with $200 in their savings account didn’t quite know how to run the @Strategy after all.
Nothing would make me happier than seeing @saylor start bull posting again.
$BTC $MSTR $STRC
🔴The majority of economists on mainstream networks are stating that the markets are pricing in 3 rate hikes.
Since Con-vid there have been drastic price increases resulting from supply chain disruptions & shocks including with OIL. It’s never come from the demand side. Even when government stimulated it was due to economic stress. These same economists now have to admit the K shaped reality years later. The only real demand side increase was in toilet paper 🧻, only because so many people are so full of crap about this, even today. Booth is citing real world examples of stress in the public business environment in the U.S. while it falls on deaf ears by the majority of pundits.
✅- Growth has been steadily positive and in the 4–6% range recently (after bottoming out years earlier).
This net expansion reflects the liquidity support above plus resumed deposit growth, bank lending in certain areas, and shifts out of higher-yielding alternatives as conditions evolve. M2 growth doesn’t always equal “easy money” for the real economy (it can stay in financial assets), but it confirms liquidity isn’t contracting overall.
Why This Matters in Context
This “hidden” liquidity via repos, ON RRP runoff, and targeted purchases helps explain why financial conditions remain supportive for asset prices (top of the K-shape: stocks, housing for owners, etc.) even as official policy has tightened and the real economy shows cracks (job quality issues, bankruptcies, bottom-end struggles per alternative data Booth cites).
It props up the system without full-throated QE, reducing immediate recession risk from liquidity crunches—but it doesn’t fix underlying weaknesses like uneven consumer strength or debt burdens. If these injections were absent, stresses (repo spikes, funding squeezes) could have amplified faster.
Booth’s point aligns with broader analyst views: The Fed prioritizes smooth functioning (“ample reserves”) over pure QT optics. Markets often price this support in quickly.
This dynamic is why some see persistent liquidity tailwinds despite the hawkish rate-hike pricing we discussed earlier. It reinforces caution on assuming aggressive tightening will easily “cool” everything without side effects.
She notes that while the Fed has been in a Quantitative Tightening (QT) phase—allowing its balance sheet to shrink by not fully reinvesting maturing assets—liquidity is still being injected through backdoor or technical channels, particularly the repo markets and related facilities. This acts as a form of “stealth QE” or liquidity support, even if not labeled as traditional large-scale asset purchases for economic stimulus.
This keeps financial plumbing functioning and supports broader liquidity conditions, which helps explain resilient asset markets (stocks, etc.) despite the uneven (“K-shaped”) real economy.
Key Elements of the Liquidity Dynamic
1. Repo Markets as Liquidity Channels
The repo (repurchase agreement) market is where institutions borrow cash short-term (often overnight) by posting high-quality collateral like Treasuries. It’s a core part of the financial system’s plumbing for short-term funding.
• The Fed operates facilities like the Standing Repo Facility (SRF): Banks can borrow reserves directly from the Fed against collateral at a set rate. Usage spikes during liquidity stress (e.g., ~$74B on Dec 31, 2025; ongoing smaller amounts in 2026 when repo rates briefly exceed the Fed’s target). This temporarily injects reserves into the banking system.
• Private repo activity is huge (trillions daily), with players like hedge funds running basis trades. The Fed’s SRF acts as a backstop to prevent spikes from escalating.
• Booth emphasizes these operations inject billions regularly (monthly/ongoing basis), but they receive less media attention than headline rate decisions or full QE. It’s not “printing money” for stimulus per se—it’s technical support to keep markets functioning smoothly.
2. ON RRP Runoff as Effective Liquidity Injection
The Overnight Reverse Repo (ON RRP) facility lets money market funds and others park excess cash at the Fed (earning a return). At its 2023 peak, it absorbed trillions in reserves.
As usage has plummeted in 2025–2026 (recent daily/weekly averages often in the low billions or near zero in some periods), the cash flows out of the facility and back into the banking system or other investments. This releases reserves without the Fed buying new assets—functionally adding liquidity to the system.
This is a major reason why liquidity hasn’t dried up as much as pure QT math would suggest.
3. “QE Light” or Targeted Purchases (Late 2025 Onward)
In December 2025, the Fed announced it would buy short-term Treasury bills (and if needed, other short Treasuries) starting mid-December to maintain “ample reserves.” Markets interpreted this as liquidity support or QE restart (“QE light”). The balance sheet bottomed around ~$6.54T in early December 2025 and has since stabilized/fluctuated around ~$6.73T as of late June 2026 (not aggressive ongoing shrinkage).
Booth frames this as the Fed ensuring the system doesn’t face strains (e.g., around tax seasons or year-end), rather than full stimulus QE. It prevents QT from becoming too contractionary.
4. Other Supporting Flows
• Treasury General Account (TGA) spending injects liquidity when the government spends.
• Shifts in bank lending, deposit behavior, and international flows also play roles.
• Overall, even as QT reduces the Fed’s balance sheet slowly, these mechanisms offset drains.
M2 Money Supply: Net Positive Growth
Yes, M2 is increasing on a net positive basis.
M2 (cash + checking/savings deposits + money market funds + small time deposits) contracted sharply in 2022–early 2023 amid aggressive rate hikes (YoY growth turned negative). It has since turned around:
• As of May 2026: M2 ≈ $22.97 trillion (not seasonally adjusted), +0.15% month-over-month and +5.6% year-over-year.
• April 2026 readings showed ~+4.7% YoY growth.