These #Bitcoin RSI Bollinger Band % phases are the most accurate I've seen for the true cycle top in price.
It was able to weed out both first April double tops in 2013 and 2021 to only call each final top, something almost no indicator has been able to do. (purple phase 5)
Where does it say we are now?
After the 3rd cross of the red .99 value line in March 2024 we have completed phase 3 which is the second early top. (orange dots)
These phases told us that this move wouldn't firmly move us above ATHs, which happens after phase 4.
We've now reached the same critically low levels of RSI BB% that we've seen at each cycle bottom and even the 2020 black swan. (green arrows)
2 more phases and most of the best price action still left to go this cycle!
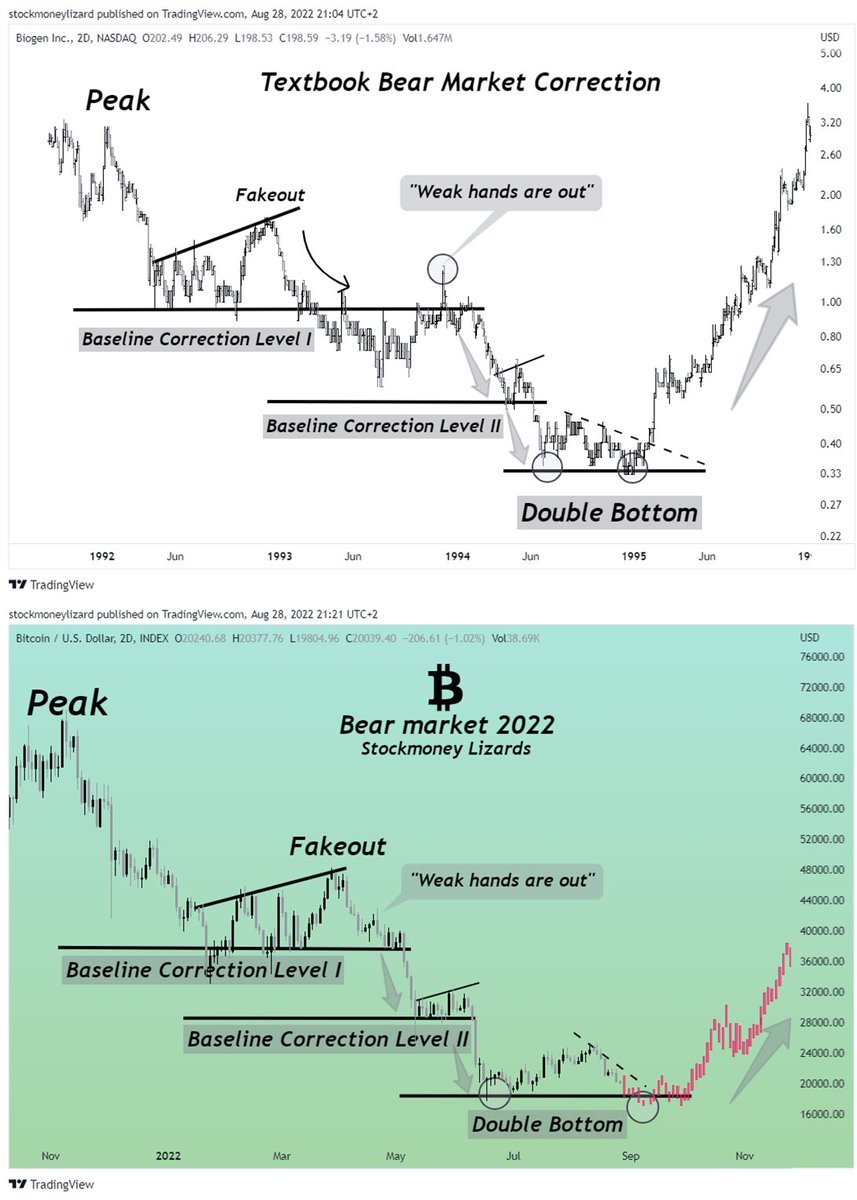
#Bitcoin - Just like most have got excited every time we've ran to the top of this range most are fearful now that we are at the bottom. It's still holding and we are simply returning to the major HTF channel.
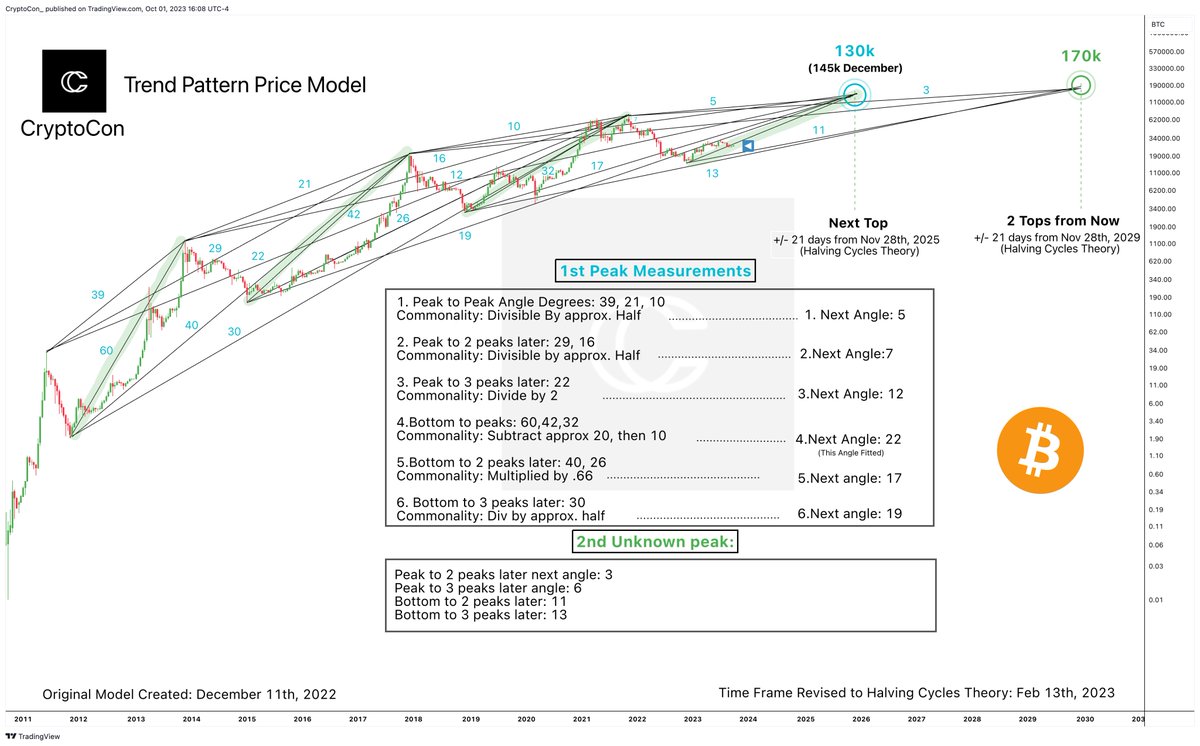
#Bitcoin has remained in the green highlighted path of the Trend Pattern Price model wonderfully!
This is marked by a trend line drawn from the cycle bottom, to the next predicted top of 130k by Nov 2025, and even 145k by Dec 2025.
When the path is laid out in front of you, price targets over 100k don't look so unachievable at all.
The second top in 2029 is predicted at 170k, but when this cycle is complete we can increase the accuracy.
Math is beautiful 🌹, Onwards and upwards!
In the 2019 bear market bottom, I got caught on the sidelines waiting to buy #Bitcoin lower. I listened to on-chain gurus and their favorite metrics.
Learn from my mistakes. Thread on:
- Which Bitcoin price metrics have value & why
- Where we are in the Bitcoin market cycle
Do know when does the actual BullRun starts ??
Bull Run of $BTC is tagged with USA Presidential Elections
2012
~Pre-Presidental Elections Drop of 52%
~MACD Bullish Crossover
~All Major EMA Bullish Crossovers
~Post-Presidential Elections BullRun-11800% Pump
#Crypto
1/4 🧵
#Bitcoin
"This time is different" - and yet, market psychology turns out to be true in ANY chart - over and over again💯💯💯
“The intelligent investor is a realist who sells to optimists and buys from pessimists.”
Benjamin Graham 🌼
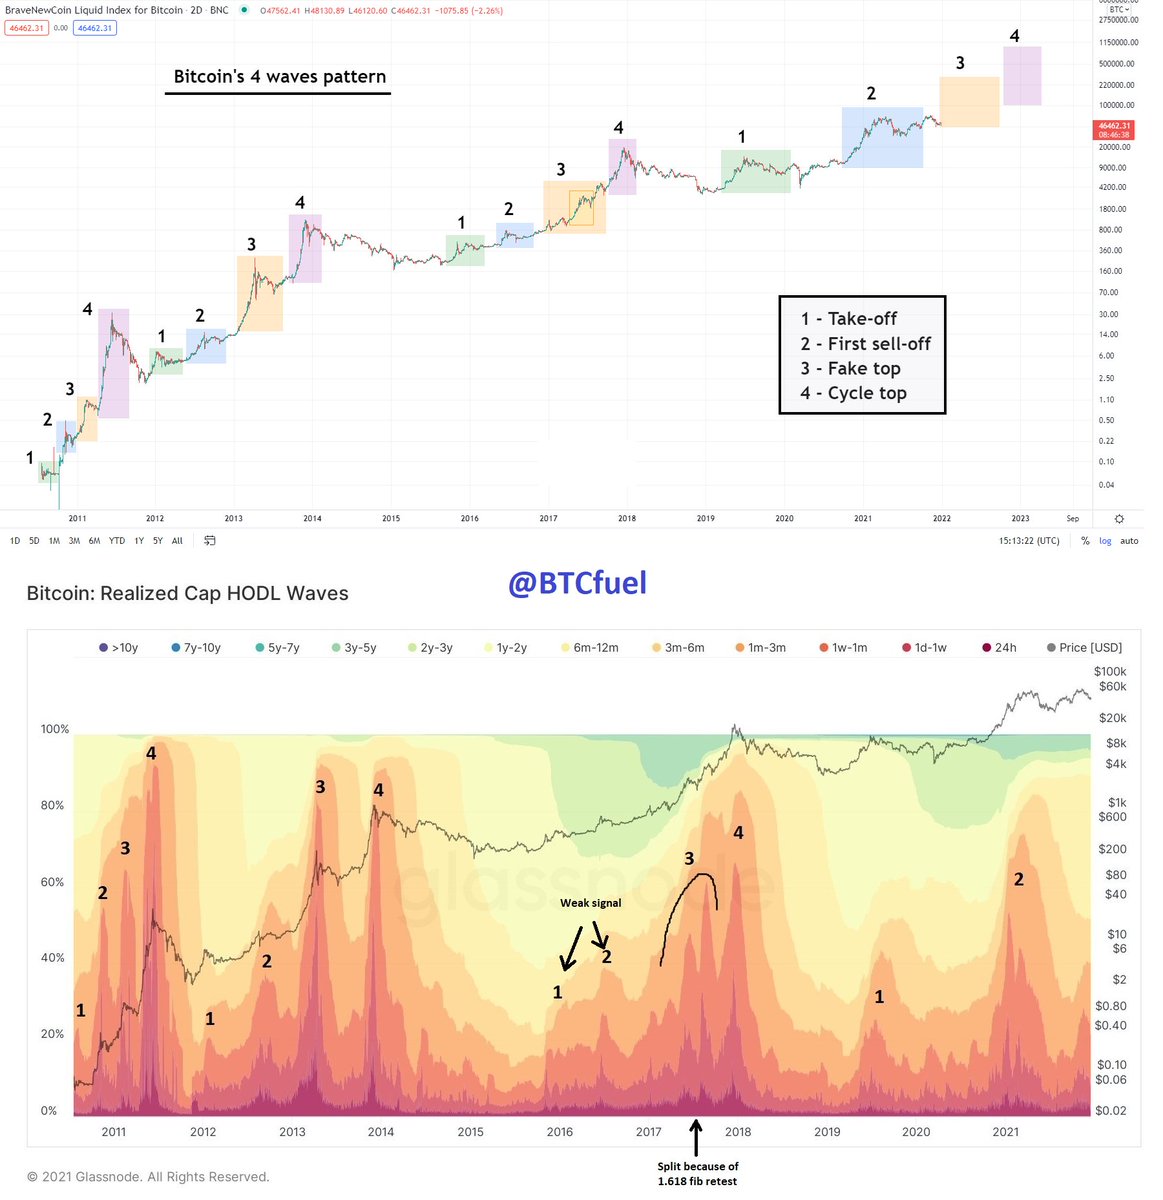
#Bitcoin has a 4 waves pattern that happens every cycle. These 4 waves are demand waves and happen when a lot of money flows into Bitcoin in a short timeframe. The 4 waves are clearly visible in the Realize Cap HODL Waves indicator
2021 was good to crypto.
Next year things will look different b/c of changes in macro environment & tech adoption cycle.
Here are top 3 crypto investment themes I’m bullish 📈 & bearish 📉 about for 2022 👇
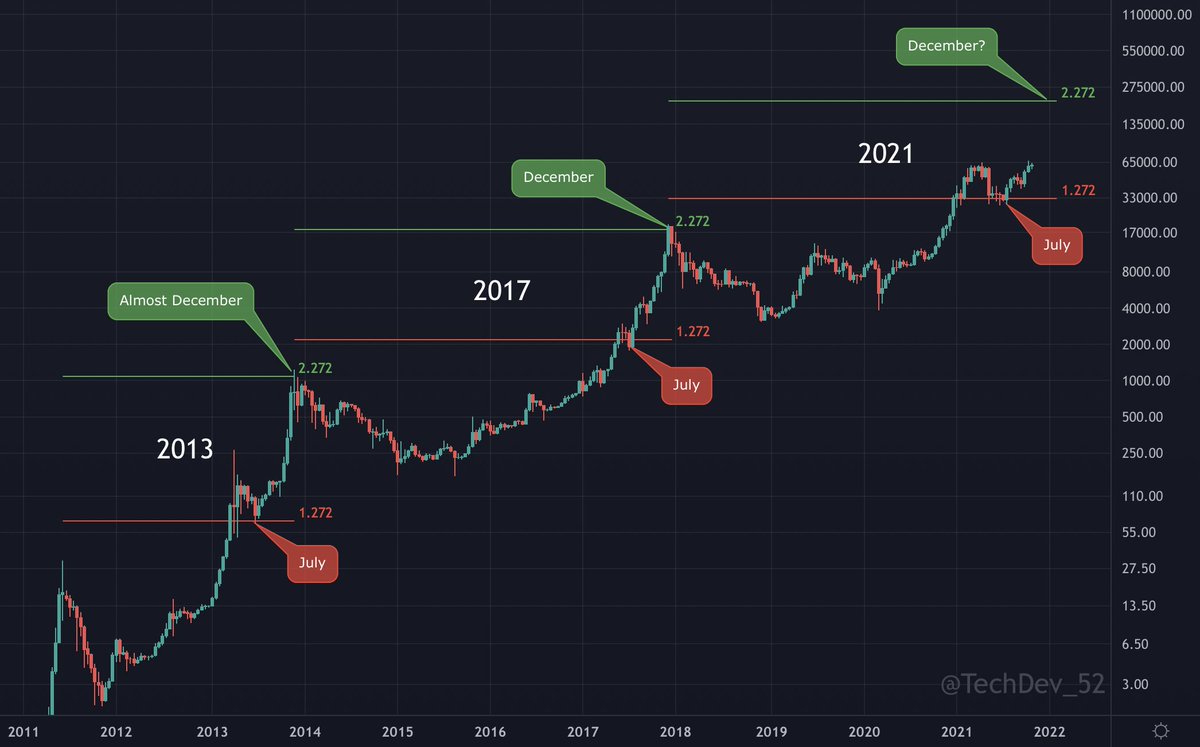
There's a simple elegancy in #Bitcoin's macro price history.
_____ 1.272 in Jul 2.272 near Dec
2013 ✅ ✅
2017 ✅ ✅
2021 ✅ ❓
Covered in detail in 1st newsletter: https://t.co/2YFJr2ggpk