What is the Polytrends Algo?
A charting algorithm developed by @TraderSum0 and his team, designed to help you track trends algorithmically and their subsequent significant levels of support and resistance within the Tradingview charting platform.
https://t.co/IODmUYGvlY
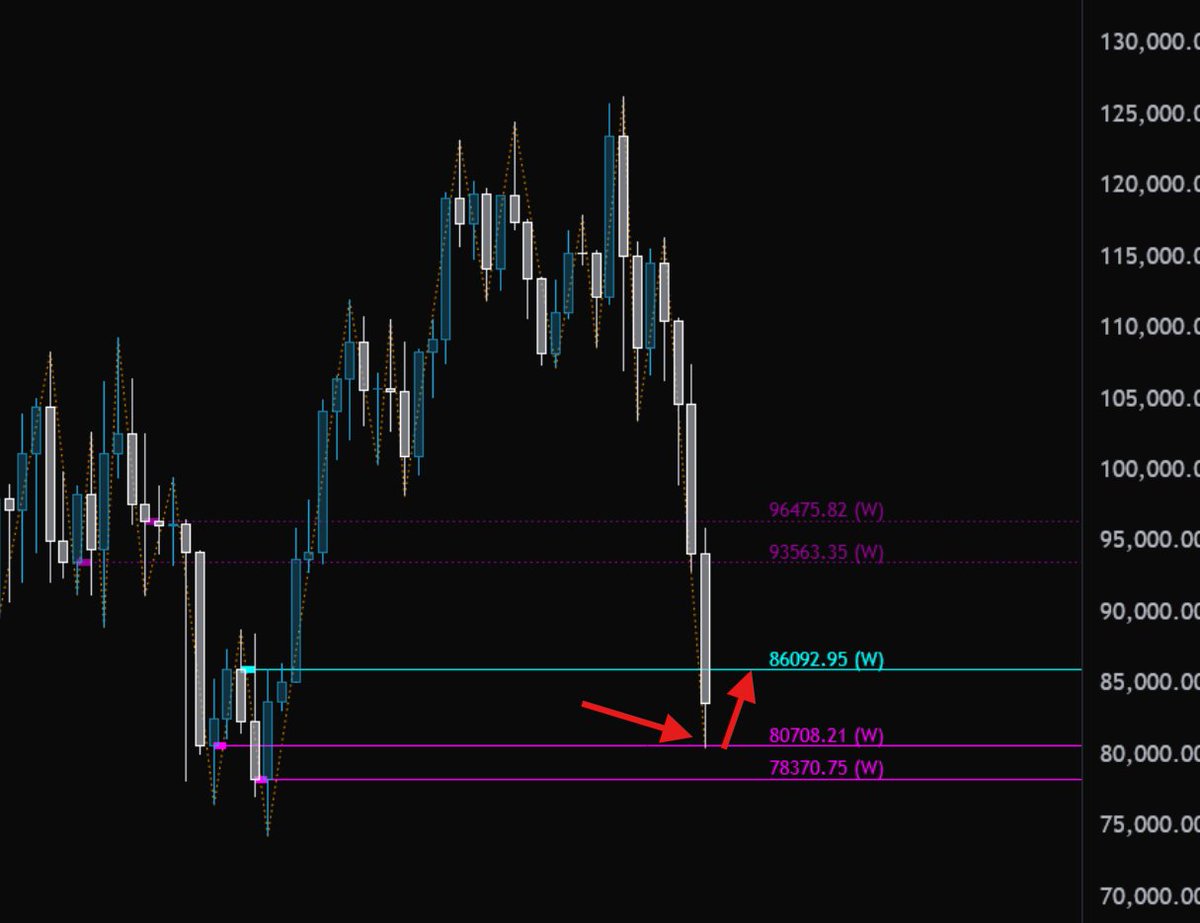
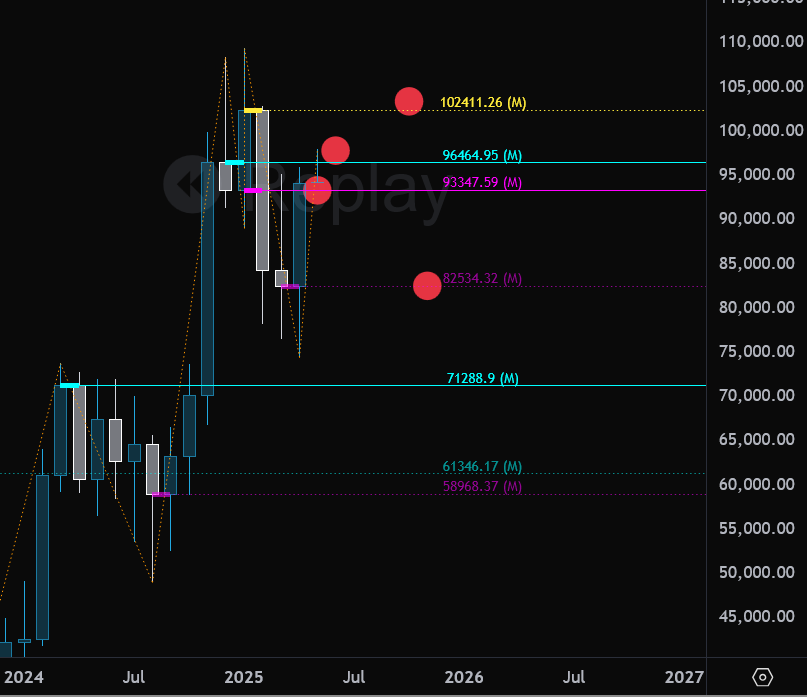
It's probably just a coincidence that @PolytrendsAlgo was able to plot all the major monthly levels that $BTC played before it happened.
Or it's some secret sauce that very few people know.
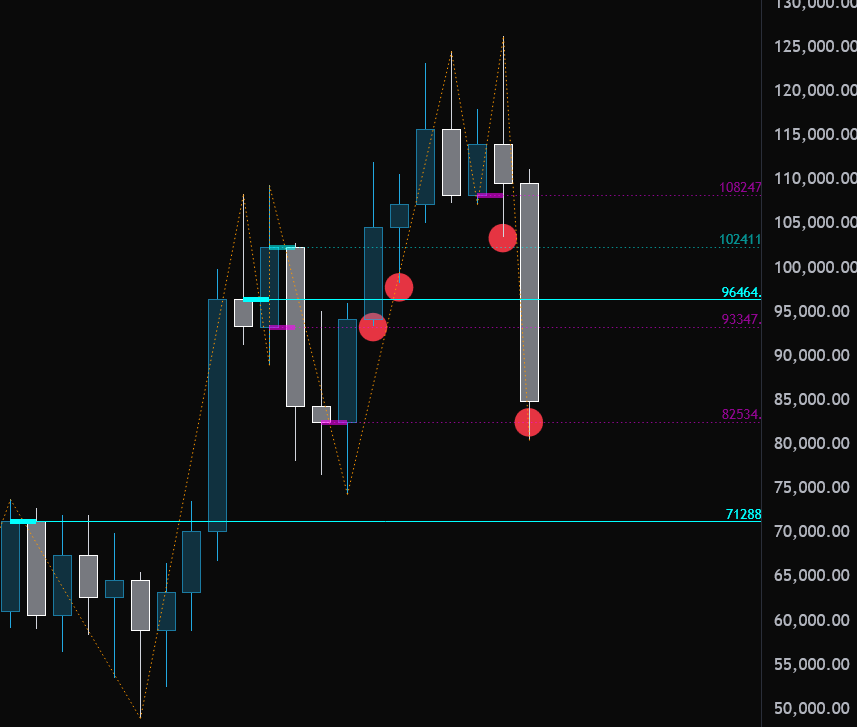
All of the Bitcoin significant levels that you will need, for the time being, are drawn algorithmically by the @PolytrendsAlgo
Why is it useful?
-It draws levels more accurately than most people could otherwise, (on all time-frames).
-It doesn't make mistakes.
-It saves time.
-It simplifies your trading process.
Polytrends users have an edge over non-users because they see levels that others do not.
Let the algo help you, help yourself: https://t.co/sM0qyvuqCs
Show me another charting algo besides the @PolytrendsAlgo that gave you these important levels for #Bitcoin when it was at all-time highs?
I'll wait...
https://t.co/eCSga6xRvd
@EvilPhoebu7637@TraderSum0 The settings you use should be based on how much information you want to see. In the settings tab, hover over these to help you understand what each setting does.
Want to see less level? Reduce the Above/Below numbers.
Want to see more levels further left? Increase Rel Factor.
I built my charting logic into an algo for you on Tradingview, and it's perfect for people that tend to miss a lot of key levels, or simply want a mechanical system.
The @PolytrendsAlgo draws the most important levels on the chart for you, according to the settings you pick.
You can easily see the two levels it plotted for $GOLD and how the price is currently respecting them.
https://t.co/sM0qyvuqCs
Woke up to another @PolytrendsAlgo scan results since March. Have to go through and manually verify all of these results.
Scans aim to have multiple theoretical targets. First of which will always be a lower R-value, but should, in theory, yield at least a 70% win rate.
@alextub1@TheTradingGuid1@TraderSum0 Polytrends track the relative trends and plot the most significant levels within those trends.
The strategy you use to trade those levels is up to you.
Does your indicator provide you with the most significant levels automatically?
Our algo plots them for you. Just look at the recent action in #bitcoin where the Polytrends algo automatically charted them for you!
Let Polytrends charts for you!
https://t.co/IODmUYGvlY