Hi @Wllmwisdom,
I hope this helps you.
Automation means using technology or systems to perform repetitive tasks automatically with little or no manual effort.
In data analysis, automation is the system or processes that automatically collect, clean, transform, analyze, and visualize data without having to repeat the same steps every time.
Why you should automate your work
• Saves time
• Reduces human errors
• Makes reporting faster
• Improves consistency
• Helps analysts focus more on insights instead of repetitive tasks
• Makes dashboards and reports update automatically
Examples of Automation in Data Analysis:
• Automatically refreshing dashboards daily
• Sending reports automatically through email
• Cleaning raw datasets using predefined steps
• Updating KPIs in real time
• Automating data collection from forms, APIs, or databases
How automation applies in different analysis tools:
1- Excel
• Macros & VBA
• Power Query refresh
• Automated formulas/templates
2-Power BI
• Scheduled refresh
• Power Query transformations
• Power Automate integration
• Automated dashboard updates
3-SQL
• Stored procedures
• Scheduled queries
• Automated ETL pipelines
4-Python
• Data cleaning automation
• Web scraping
• Automated reporting
• Data pipelines & scripting
5- Business Automation Tools
• Power Automate
• Zapier
• https://t.co/9Kn3Hpb7hj
• Zoho Flow
I hope you find this valuable.
Keep learning, keep building, keep analysing, and keep automating.
Warm regards,
Ekanem
Power BI Developer & Data Analyst
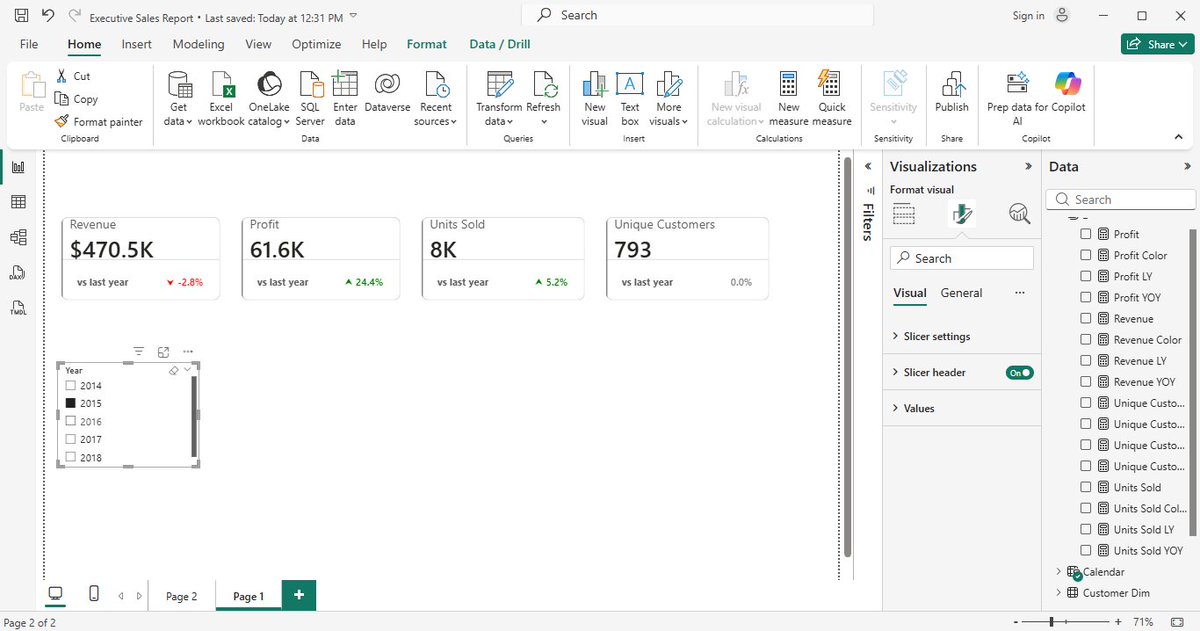
Finally got to finish the guided project with @Rita_tyna.
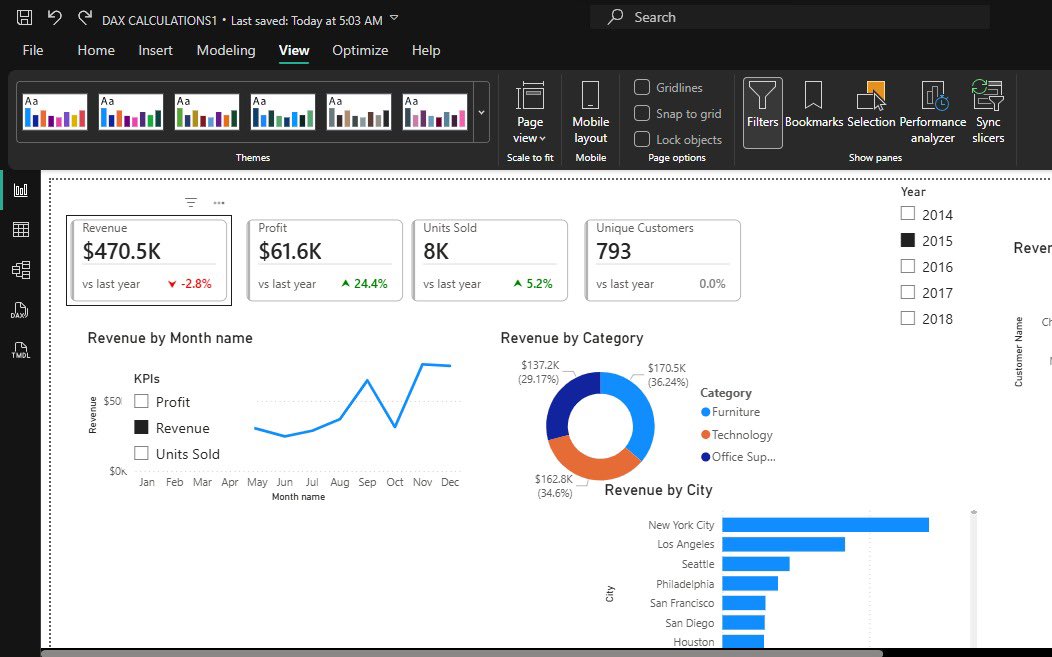
Key insights:$2.3M total revenue, $286K total profit, 38K units sold, 793 unique customers.
Monthly trend analysis showed February as the lowest performing month, recording the lowest revenue, profit, and units sold.
Dear @as02774 and every other beginner that is learning.
I will start by saying “completing one course perfectly before starting another.”
This approach actually increases forgetting.
In data analytics, the better strategy is layered learning + continuous reuse, not one-course-perfection because every tool is interconnected to each other.
Here’s how to move from one course to another without losing the previous one:
1. Learn in Layers, Not in Isolation
Think of your skills like a stack:
Excel = foundation for analysis & reporting
SQL = data extraction & structuring
Power BI = visualization & storytelling
You don’t leave Excel behind when learning SQL. You carry it forward.
So instead of:
Finish Excel → forget → start SQL → forget → start Power BI
Do this:
Learn Excel → use it while learning SQL → use both while learning Power BI
2. Always Combine Old + New Skills
Every time you learn something new, force a connection:
Excel + SQL → import SQL results into Excel PivotTables
SQL + Power BI → write SQL queries as data source
Excel + Power BI → compare dashboard outputs with Excel analysis
This “mixing” is what locks knowledge in memory.
3. Build One Evolving Project
Instead of separate projects per tool:
Start ONE project and upgrade it:
Example: Sales Analysis Project
Stage 1 (Excel): clean and analyze sales data
Stage 2 (SQL): store and query the data
Stage 3 (Power BI): build dashboard on top of it
Result:Same dataset. Same story. Different tools.
This prevents forgetting because you’re not starting over, you’re building on memory.
4. Use “Active Recall” Weekly
Once a week, without tutorials:
redo a SQL query from memory
rebuild an Excel PivotTable
recreate a Power BI visual
Even if you forget and check notes, that struggle is what strengthens memory.
5. Keep a Mini Revision Routine
You don’t need long study sessions.
Try this simple rotation:
Mon: Excel (30 mins)
Wed: SQL (30 mins)
Fri: Power BI (30 mins)
Result:
This keeps all tools “alive” in your brain.
6. Don’t Wait for Mastery Before Moving On
This is a common beginner mistake.
You don’t need to master Excel before SQL. You don’t need to master SQL before Power BI.
In real jobs:
you learn while working
you revisit tools when needed
7. Focus on Concepts, Not Tools
Tools will fade if you focus only on buttons.
But concepts stay:
filtering data
grouping data
relationships
aggregation
visualization logic
Once you understand these, you can switch tools anytime.
Even experienced analysts still Google SQL syntax, DAX formulas, or Excel functions. What matters is not memorizing everything, but building the ability to:
understand concepts,
know where to find answers,
and apply them repeatedly.
Simple Rule to Remember:
“don’t finish tools. Reuse them.”
Yours in data,
Ekanem
Data Analyst | Power BI Developer
Day 50/120✅
Long time no posts…..but better late than never right?
Laptop got spoil which put my learning on hold for sometime.
Here’s what I’ve done so far:
I started a guided project with @Rita_tyna in Power BI.
Day 72/120: Overview page of the Supplier Performance Dashboard.
Worked through DAX, time intelligence, parameters, charts, and dashboard design.
Challenging, but one of the most practical projects so far. #DataAnalyticsLockedIn
Day 50/120 – Guided project
I continued building my retail dashboard in Power BI and started connecting more meaning to the numbers I've been working with.
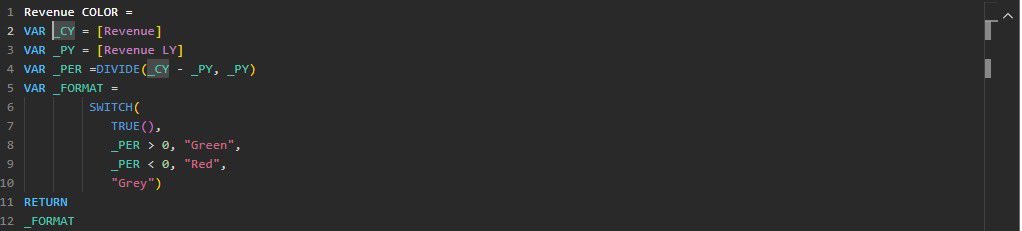
I also learned how the VAR function helps store calculations and makes DAX measures cleaner and easier to read. Then I added everything into KPI cards so the changes in performance could be seen instantly on the dashboard.