Completed Week 1 of Data Analytics Internship at @decodelabs_tech
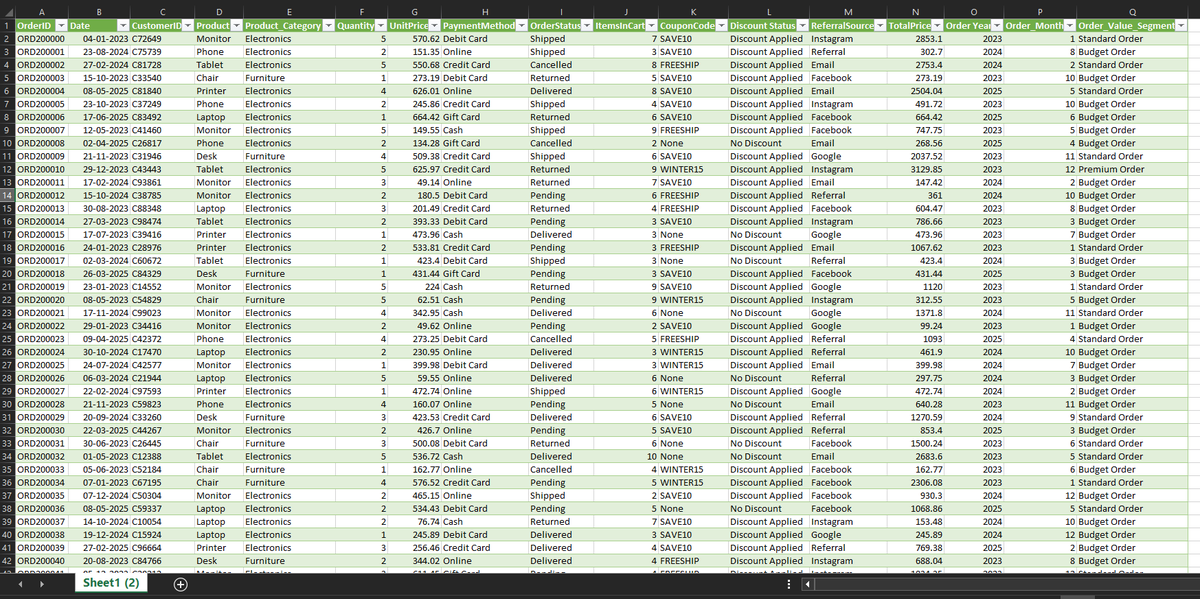
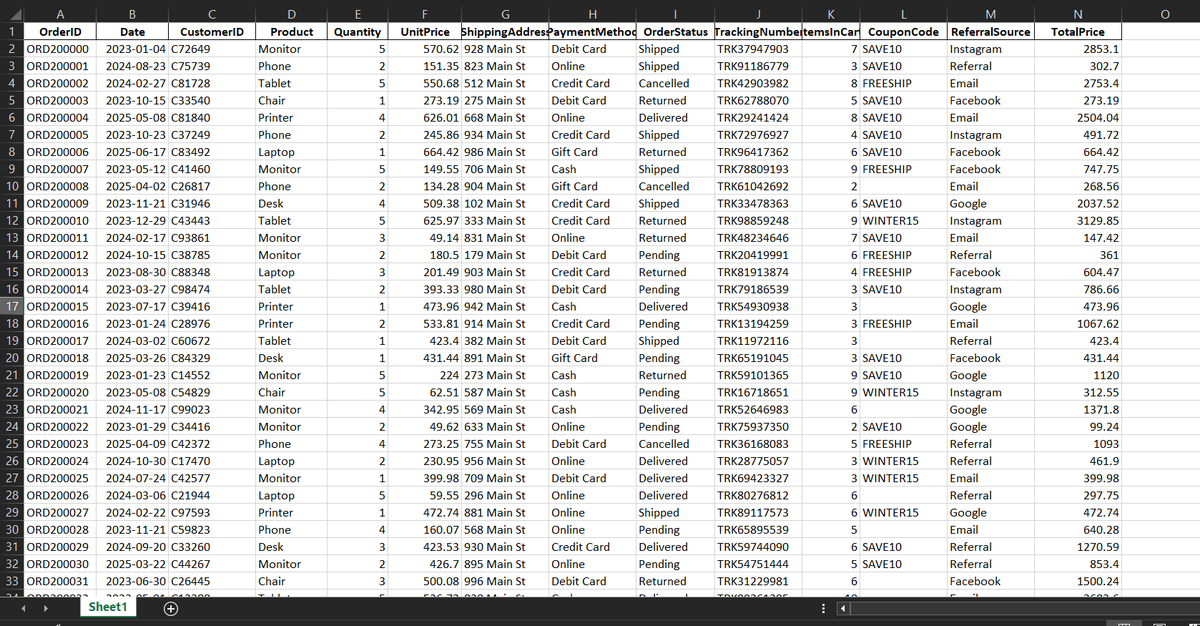
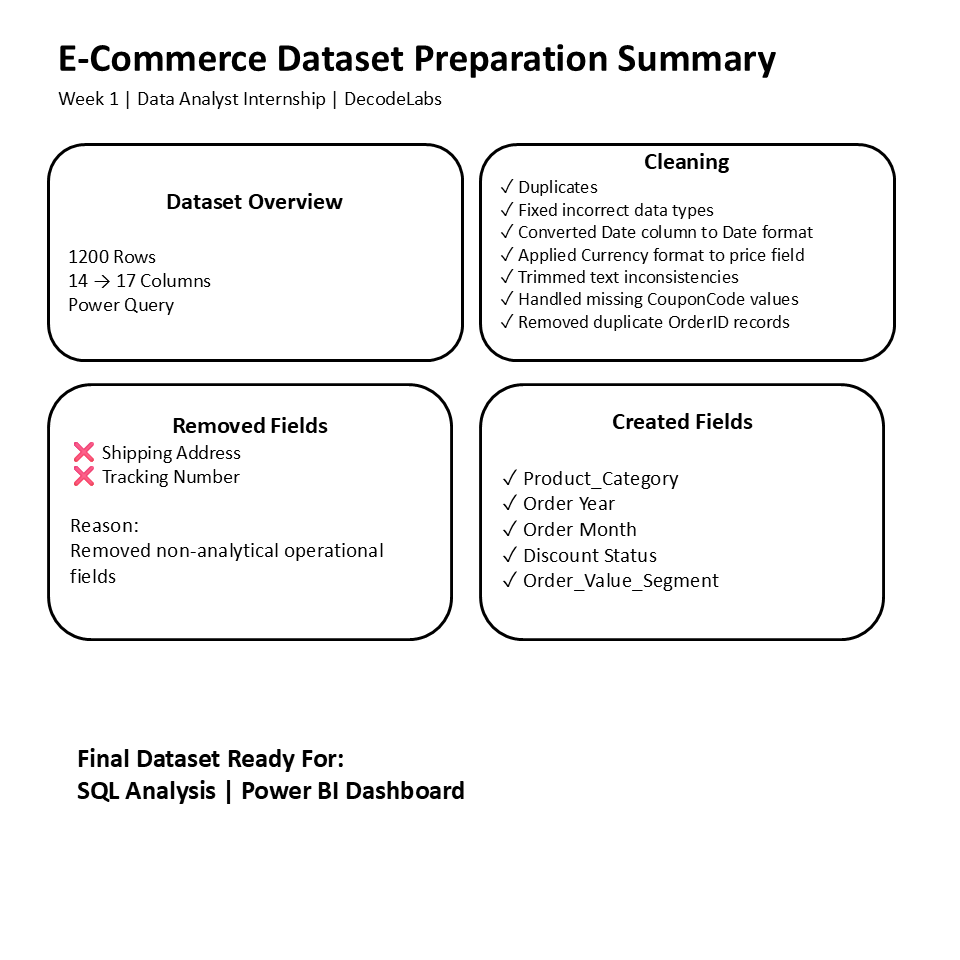
Took 1,200+ row e-commerce dataset and transformed it in Power Query
✅Changed format, fixed data types
✅Handled missing values, removed duplicate
✅Added new column-Product Category, Order Segments, Time group
@fabiolauria92@decodelabs_tech Noted! Connecting data back to actual business problems is my primary goal for this internship. I'll definitely be sharing my takeaways on that perspective shift right here.
Day 48/60: Forging Undeniable SQL🚀
Crushed @DataLemurHQ arithmetic challenges today! Beyond the code, I focused on translating raw data into business value:
💊 Pharmacy: Profit/loss & pricing
📈 Stocks: Volatility & risk
💳 Cards: Issuance seasonality
#SQL#DataAnalytics
@BiibaD3@chidirolex@AnalystPlaybook Thats impressive!
I just started my Data Analyst journey few months back. But now I am finding it hard to connect dots and to move forward from here. Could you plese guide me how you prepared for this role and what kept you motivated throughout the journey<
Day 47/60: Context is everything. ⚙️🧠
Scaled up my Power BI semantic layer to master the core physics of the engine.
The Deployment:
-Optimized memory caching via VAR/RETURN execution lines.
-Engineered dynamic temporal filters (Friday Sales) and set operations🚀
#PowerBI#DAX
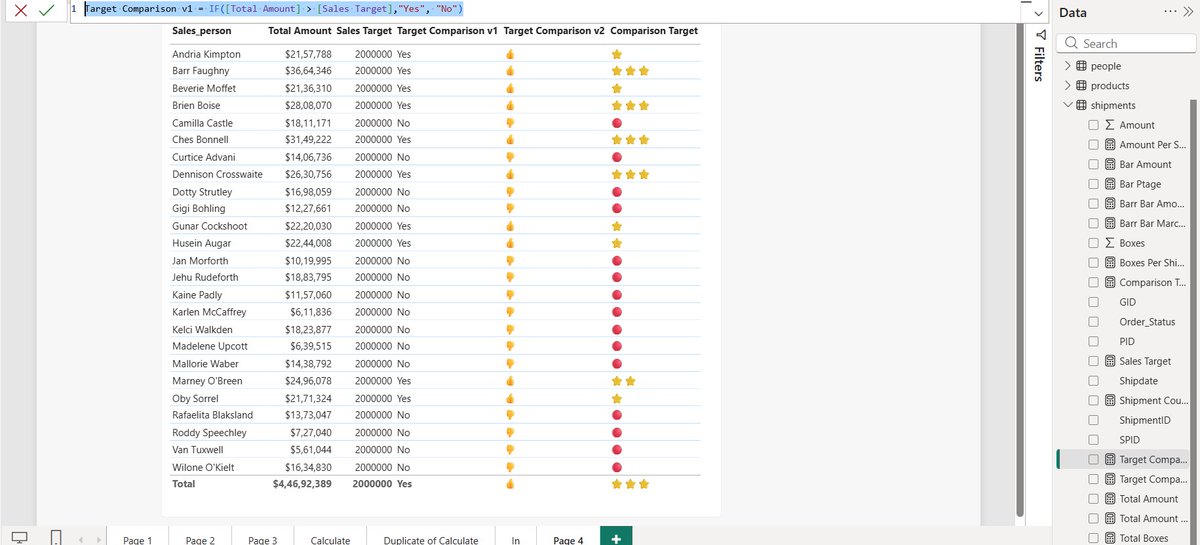
Day 46/60: The semantic data modeling⚙️📊
Spent today mastering the core DAX engine to manipulate filter contexts
The Deployment: Engineered safe aggregations (DIVIDE vs `/`)
Built dynamic logic branches (SWITCH, IF)
Overrode default visual filters using CALCULATE #PowerBI#DAX
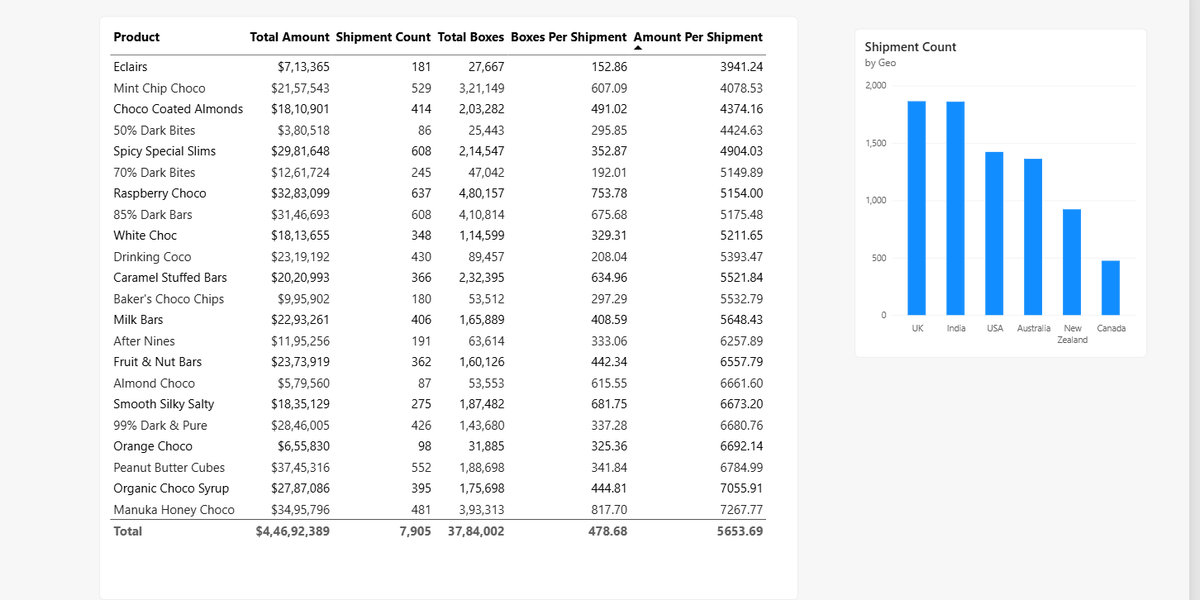
Day 45/60: Entering the Power BI & Semantic Modeling phase📊
Created the first "Global Revenue Telemetry" report, highlighting the core $27.72M revenue and 2M volume metrics alongside geographic and product distribution
Do rate and review
#PowerBI#DataAnalytics#BuildInPublic
Day 44/60: Start linking tools🔗
Reverted back to SQL today to solve the @DataLemurHQ PayPal Final Account Balance & IBM Db2 Product Analyst challenges
Massive shoutout to @ezekiel_aleke for the mindset shift needed: real value is in the pipeline, not the isolated tool 🚀
#SQL
Day 41-42: Functional Code in Excel.
Replaced legacy row-by-row tracking with an Matrix Engine using LET, LAMBDA, MAP, SCAN.
The Build: Deployed a dynamic accumulator (SCAN) to track sales telemetry. It instantly outputs the date a rep crosses the "500 Lead" with O(N) efficiency
Dear @as02774 and every other beginner that is learning.
I will start by saying “completing one course perfectly before starting another.”
This approach actually increases forgetting.
In data analytics, the better strategy is layered learning + continuous reuse, not one-course-perfection because every tool is interconnected to each other.
Here’s how to move from one course to another without losing the previous one:
1. Learn in Layers, Not in Isolation
Think of your skills like a stack:
Excel = foundation for analysis & reporting
SQL = data extraction & structuring
Power BI = visualization & storytelling
You don’t leave Excel behind when learning SQL. You carry it forward.
So instead of:
Finish Excel → forget → start SQL → forget → start Power BI
Do this:
Learn Excel → use it while learning SQL → use both while learning Power BI
2. Always Combine Old + New Skills
Every time you learn something new, force a connection:
Excel + SQL → import SQL results into Excel PivotTables
SQL + Power BI → write SQL queries as data source
Excel + Power BI → compare dashboard outputs with Excel analysis
This “mixing” is what locks knowledge in memory.
3. Build One Evolving Project
Instead of separate projects per tool:
Start ONE project and upgrade it:
Example: Sales Analysis Project
Stage 1 (Excel): clean and analyze sales data
Stage 2 (SQL): store and query the data
Stage 3 (Power BI): build dashboard on top of it
Result:Same dataset. Same story. Different tools.
This prevents forgetting because you’re not starting over, you’re building on memory.
4. Use “Active Recall” Weekly
Once a week, without tutorials:
redo a SQL query from memory
rebuild an Excel PivotTable
recreate a Power BI visual
Even if you forget and check notes, that struggle is what strengthens memory.
5. Keep a Mini Revision Routine
You don’t need long study sessions.
Try this simple rotation:
Mon: Excel (30 mins)
Wed: SQL (30 mins)
Fri: Power BI (30 mins)
Result:
This keeps all tools “alive” in your brain.
6. Don’t Wait for Mastery Before Moving On
This is a common beginner mistake.
You don’t need to master Excel before SQL. You don’t need to master SQL before Power BI.
In real jobs:
you learn while working
you revisit tools when needed
7. Focus on Concepts, Not Tools
Tools will fade if you focus only on buttons.
But concepts stay:
filtering data
grouping data
relationships
aggregation
visualization logic
Once you understand these, you can switch tools anytime.
Even experienced analysts still Google SQL syntax, DAX formulas, or Excel functions. What matters is not memorizing everything, but building the ability to:
understand concepts,
know where to find answers,
and apply them repeatedly.
Simple Rule to Remember:
“don’t finish tools. Reuse them.”
Yours in data,
Ekanem
Data Analyst | Power BI Developer
@ekanemjr_99 2. I just wrapped up the presentation layer of my own sprint—moving a 1,000-row matrix into a macro-free visual engine. If you have 2 minutes, I’d love your critical feedback on the dashboard layout: https://t.co/nmsus9nq26
Day 43/60: The Executive Presentation Layer📊
Deployed a fully interactive Call Centre Telemetry Dashboard in Excel.
Built a macro-free, high-signal UI with zero gridlines, connected slicers to dynamically track Rep. conversion efficiency and CSAT drift🚀
#DataAnalytics#Excel
@ekanemjr_99 This really changed my thinking. Kudos to you for taking out time to help a beginner like me.
It would be really helpful if you and your community can help me out with few more queries-
1. Should I stop moving towards PowerBi and start linking my Excel and Sql knowledge before?
@ekanemjr_99 I am consistently trying to learn data analytics. Recently I finished Sql and Excel . Will start Power bi soon but I am skeptical that what if I forget everything that I learnt?
Day 43/60: The Executive Presentation Layer📊
Deployed a fully interactive Call Centre Telemetry Dashboard in Excel.
Built a macro-free, high-signal UI with zero gridlines, connected slicers to dynamically track Rep. conversion efficiency and CSAT drift🚀
#DataAnalytics#Excel
@msdev Trying to build a portfolio for data analyst role. Highly confused on what would be the best AI partner to help me learn and find the best insights required for this role ?