November's call is live.
$AVGO 420C 11/20 2 or less.
Massive breakout brewing on the daily. Front-running chip strength into the end of October. Target 400 by 10/31.
One swing a month. Posted before the move. 7 of 9 this year.
❤️ and repost if you like this trade.
KT read the $META options flow: heavy call selling at 900 into year end, so he sees 900 as the cap this year.
His 1,000 target was an eight month call made in July, which points to Q1 2027.
He also sees $CRWV back to about 85 by Feb or March, with $META higher by then.
It's crazy how discoveries can be made, opportunities can be found, if you just stare at the data long enough. Sometimes things look all over the place but the universe feeds you thoughts and ideas which, once applied, can somehow turn dirt into gold. You have to keep staring at the data though...
Astro Trade Log 🚀
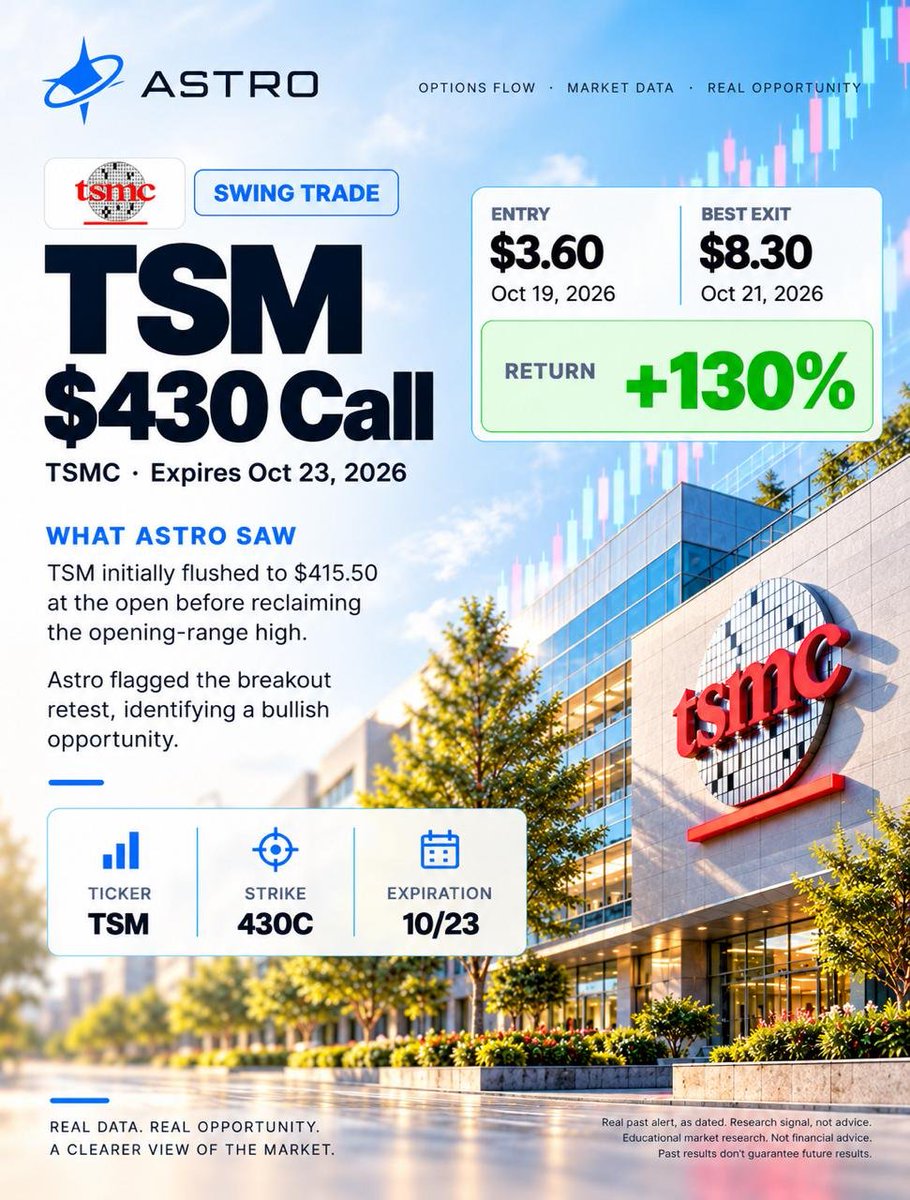
$TSM 430C 10/23 | $3.60 → $8.30 | +130% 🔥
Astro flagged the breakout retest on October 19, following a reclaim of the opening-range high.
Real data. Real opportunity. Powered by Astro Intelligence.
Research signal, not financial advice.
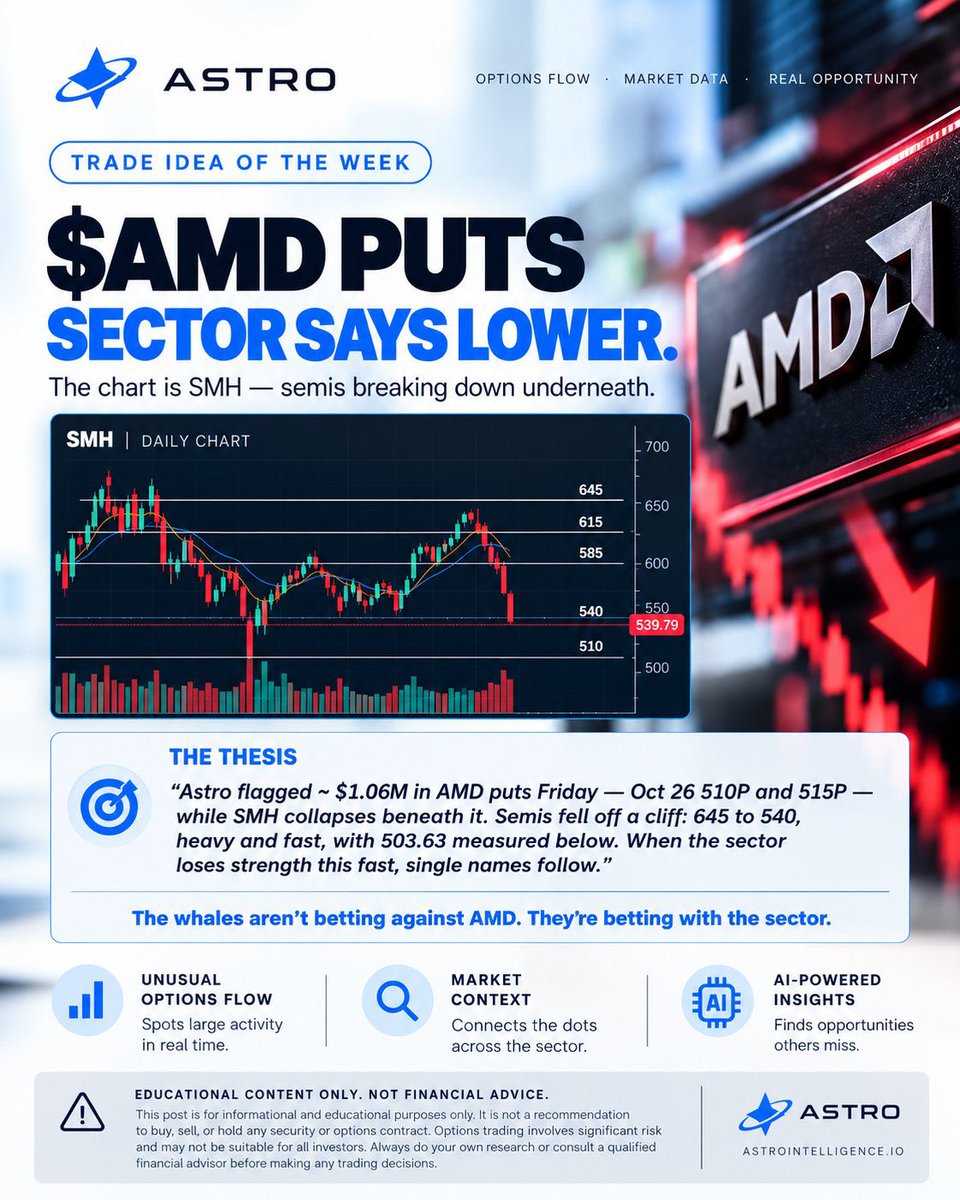
Round 2. TRADE IDEA OF THE WEEK 🚀
Last week: SNDK puts $21 → $250. Round one: mine.
This week
My pick: $GOOGL 350C 10/23 (~$2). Lower trendline keeps holding. Lose it → wait for the reclaim.
Bot's pick: $AMD 515P 10/23. Sector-wide semis weakness. Already banked 540P $2.51 → $7 Friday.
Whose side are you on?
June 16, $NOK was $13.98 and loud on Twitter.
@ProblemSniper didn't buy the hype. The daily had broken its trend line and he called it a bear flag.
Nokia's around $9.25 now, down about 34%. Q3 numbers drop before the US open tomorrow.
$META just created a new type of stock that comes with zero voting power.
Here's how it works: if you own Meta stock, you'll get one of these new shares for free for every share you already have. Think of it like a 2-for-1 split and you'll own twice as many shares, each worth about half as much. Your total value stays the same, and so does your voting power.
It kicks in January 19, 2027, and the new shares will trade on the Nasdaq like normal stock.
$META 3Q AD REV. $63.06B, EST. $61.85B
META 3Q REV. $64.60B, EST. $63.33B
META 3Q REALITY LABS REV. $443M, EST. $517.7M
META 3Q REALITY LABS OPER LOSS $4.13B, EST. LOSS $5.13B
$SPY $SPX
Tomorrow looks like the day we gap over 770 and hold. Barring overnight news from Iran or others we have the confirmation 777 open for SPY this week.
$SPY up 0.26%, but beneath the surface, the market is telling a different story.
🟢 Energy ($XLE) +0.44%
🟢 Financials ($XLF) +0.40%
🔴 Communication Services ($XLC) -0.60%
CNN's Fear & Greed Index sits at 30, up from 26 yesterday, but still in Fear territory.
Yesterday's rally is being tested as sector leadership shifts.
Can strength outside the market's biggest names sustain this recovery?
US President Trump posts that he is watching data centers closely.
Full Post: "As the President of the United States, I have been watching Data Centers very closely, and have come to a very strong conclusion. New and large, in some cases gigantic, Data enters are mandated by me to make their own electricity, and give or sell any excess back to the local community, or grid, and therefore there is electric price increase. In fact, there could be a substantial decrease. Other elements likewise! If companies want to make their Data Centers popular, pay the community, and/or individuals within the community, a “dividend.” I have watched the process closely, and Data Centers that were highly unpopular in a certain area, have become extremely popular when a financial deal is struck. MAKE DEALS, and get them built!!! GREAT FOR THE U.S.A. President DJT
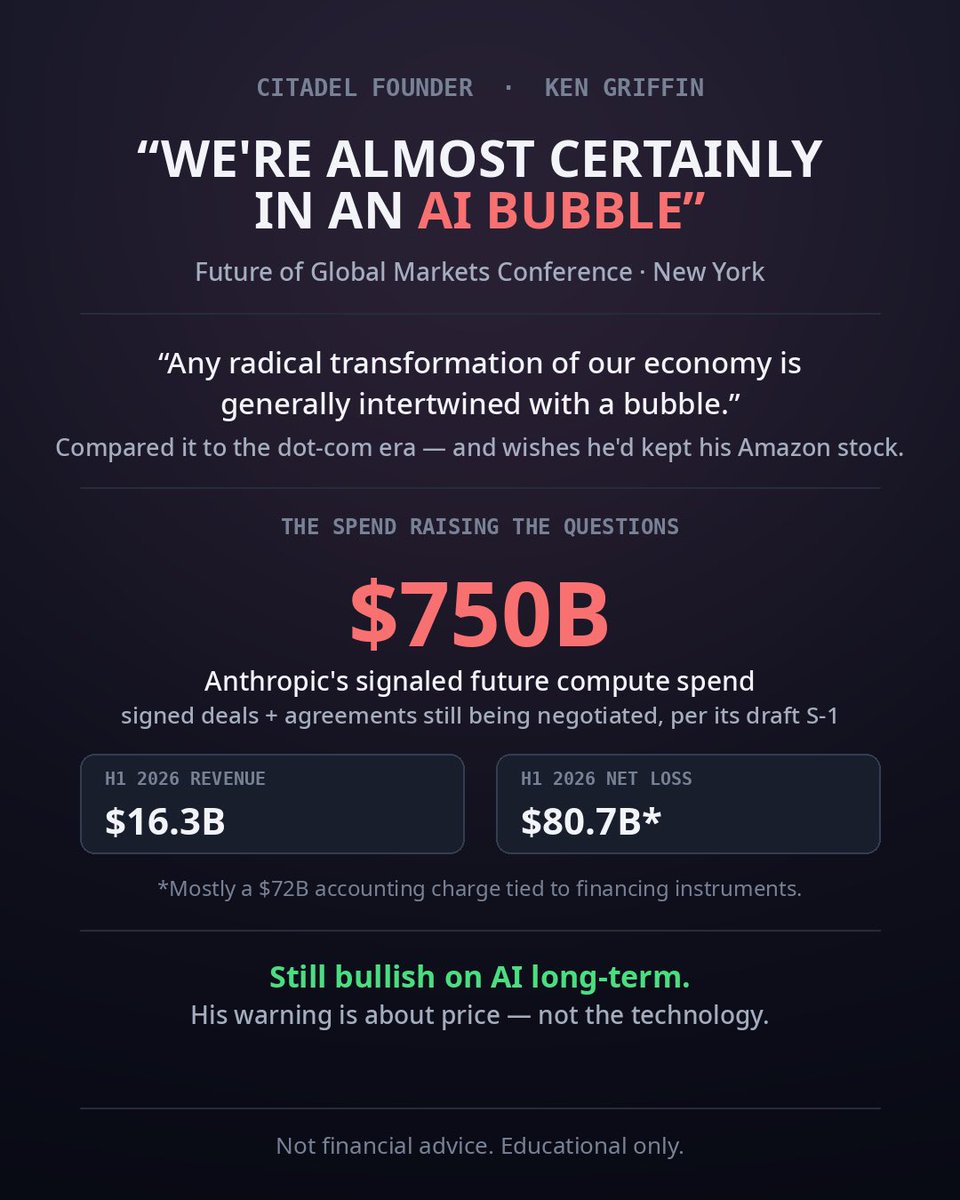
CITADEL’S KEN GRIFFIN: WE’RE ALMOST CERTAINLY IN AN AI BUBBLE
Billionaire Ken Griffin warns investors are “almost certainly” in an AI bubble, as companies struggle to turn massive AI spending into measurable productivity gains.
With Anthropic reportedly eyeing $750 billion in future computing expenditures, questions over AI investment returns are intensifying.
But Griffin remains bullish on AI’s long-term potential.