On April 28, the amazing team at @VisualCap created a gorgeous vis on my USI for U.S. cities! 🤯🙏
Since then, I've seen all feedback and now added 10 massive cities (Philly, Vegas, etc.), and recalculated the Urban Stress Index. And this time Miami is #1 !
El Paso vs Minneapolis
🏙️ El Paso: 35.3% of income
👉 https://t.co/KNKwBai8QM
🏙️ Minneapolis: 29.5% of income
👉 https://t.co/8Z5o0WjZI8
El Paso spends +5.8% more than in Minneapolis.
Which city is more affordable?
#CostOfLiving#HousingAffordability
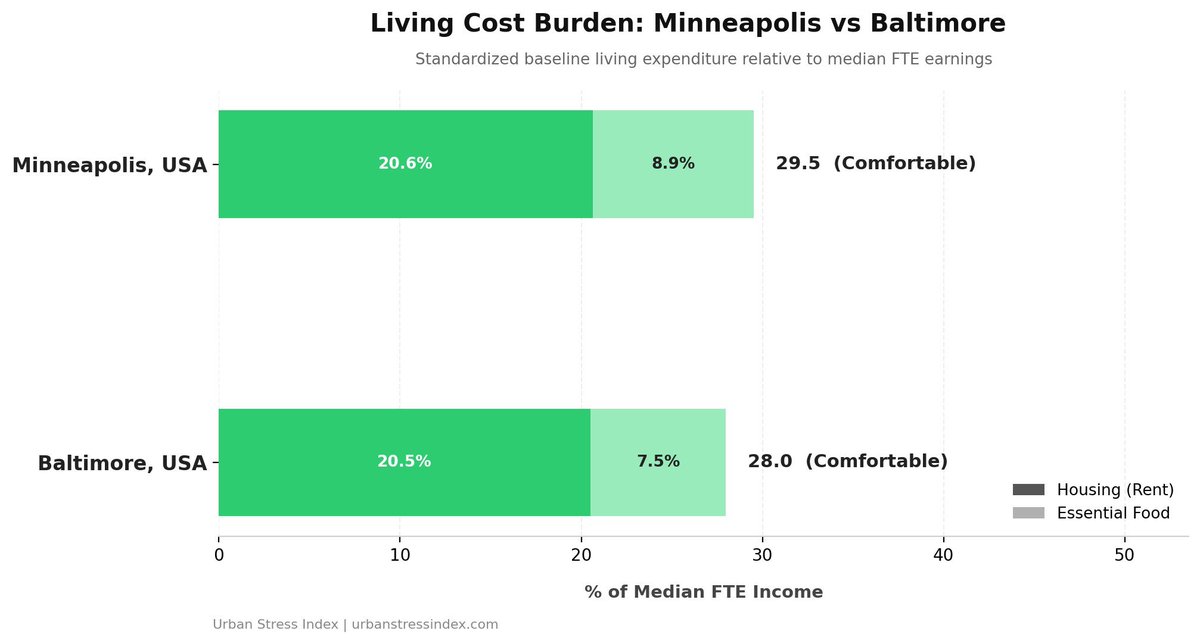
Minneapolis vs Baltimore
🏙️ Minneapolis: 29.5% of income
👉 https://t.co/8Z5o0WjZI8
🏙️ Baltimore: 28.0% of income
👉 https://t.co/Vi3b3O9QKa
Minneapolis spends +1.5% more than in Baltimore.
Which city is more affordable?
#CostOfLiving#HousingAffordability
Hololulu vs Portland
🏙️ Hololulu: 49.5% of income
👉 https://t.co/boKcvFoiPm
🏙️ Portland: 32.3% of income
👉 https://t.co/xHFLM23tSK
Hololulu spends +17.2% more than in Portland.
Which city is more affordable?
#CostOfLiving#HousingAffordability
New York City vs Houston
🏙️ New York City: 46.85 % of income
🏙️ Houston: 32.38% of income
New York City spends 14.5% more than in Houston.
Check your city: https://t.co/UXNMD5P1sI
#CostOfLiving#HousingAffordability
@WallStreetApes Stagnant wages vs surging prices is a math problem, and the data proves she’s 100% right. 🚨
In our 2026 Q2 index tracking BLS income vs rent/food across 42 US cities, places like Miami and San Diego have crossed the 44% survival burden.
Full data: https://t.co/mg0vPyEkP4
On April 28, the amazing team at @VisualCap created a gorgeous vis on my USI for U.S. cities! 🤯🙏
Since then, I've seen all feedback and now added 10 massive cities (Philly, Vegas, etc.), and recalculated the Urban Stress Index. And this time Miami is #1 !
@neppy The 3x rent rule is officially dead. 💀
When you map rents + food against actual median gross incomes, more than half of major U.S. cities breach the 33% line.
In Miami & San Diego, the average worker spends 44%–46% just to survive.
https://t.co/MXD2IHwsvj
On April 28, the amazing team at @VisualCap created a gorgeous vis on my USI for U.S. cities! 🤯🙏
Since then, I've seen all feedback and now added 10 massive cities (Philly, Vegas, etc.), and recalculated the Urban Stress Index. And this time Miami is #1 !
@MarketManiaCa This is exactly what the macro data shows.
In our original index, Canadian cities like Halifax, Vancouver, and Toronto completely surpassed the US with a brutal 75% income burden just for food and housing.
It's not an outlier; it's the baseline now. (Full thread on my profile)
@scottbudman@Zumper Great data from Zumper! I analyzed analysed how these rents impact locals paired with BLS wage data and food costs.
Interestingly, SF and NYC have the highest absolute rents,local salaries help to relief the burden.
Here is the full comparison: https://t.co/mg0vPyEkP4
On April 28, the amazing team at @VisualCap created a gorgeous vis on my USI for U.S. cities! 🤯🙏
Since then, I've seen all feedback and now added 10 massive cities (Philly, Vegas, etc.), and recalculated the Urban Stress Index. And this time Miami is #1 !