EMBA students saw average salaries rise 17.5% during their programs, while 40% earned a promotion 🎓
Created in partnership with the @hinrichfdn, this visualization explores the forces reshaping global leadership, the career benefits of an EMBA degree, and what executives should consider when choosing a program.
See the full infographic: https://t.co/FLe3HmvPqi #hf11
Eight of MLB’s 10 highest-payroll teams made the 2026 playoffs, yet the Mets, with the league’s highest payroll, missed out ⚾
Created in partnership with @TerzoHQ, this graphic ranks all 30 MLB teams by payroll and highlights which ones made the playoffs.
https://t.co/l52aTWe8qR #ter02
Mapped: The Male-to-Female Ratio in Every Country 👥
This graphic by Iswardi Ishak is one of the many incredible data-driven charts and stories from creators featured on our @VoronoiApp. ✅
https://t.co/UvrrU0gt9f
U.S. gold IRA assets grew 38-fold over the past 20 years, rising from $2 billion in 2005 to $76 billion in 2025 🥇
Created in partnership with @USMoneyReserve, this graphic shows the estimated growth of gold and silver IRA assets over the past 20 years.
https://t.co/OGaWaoyiI0 #usmr01
Sunday Digest 📊
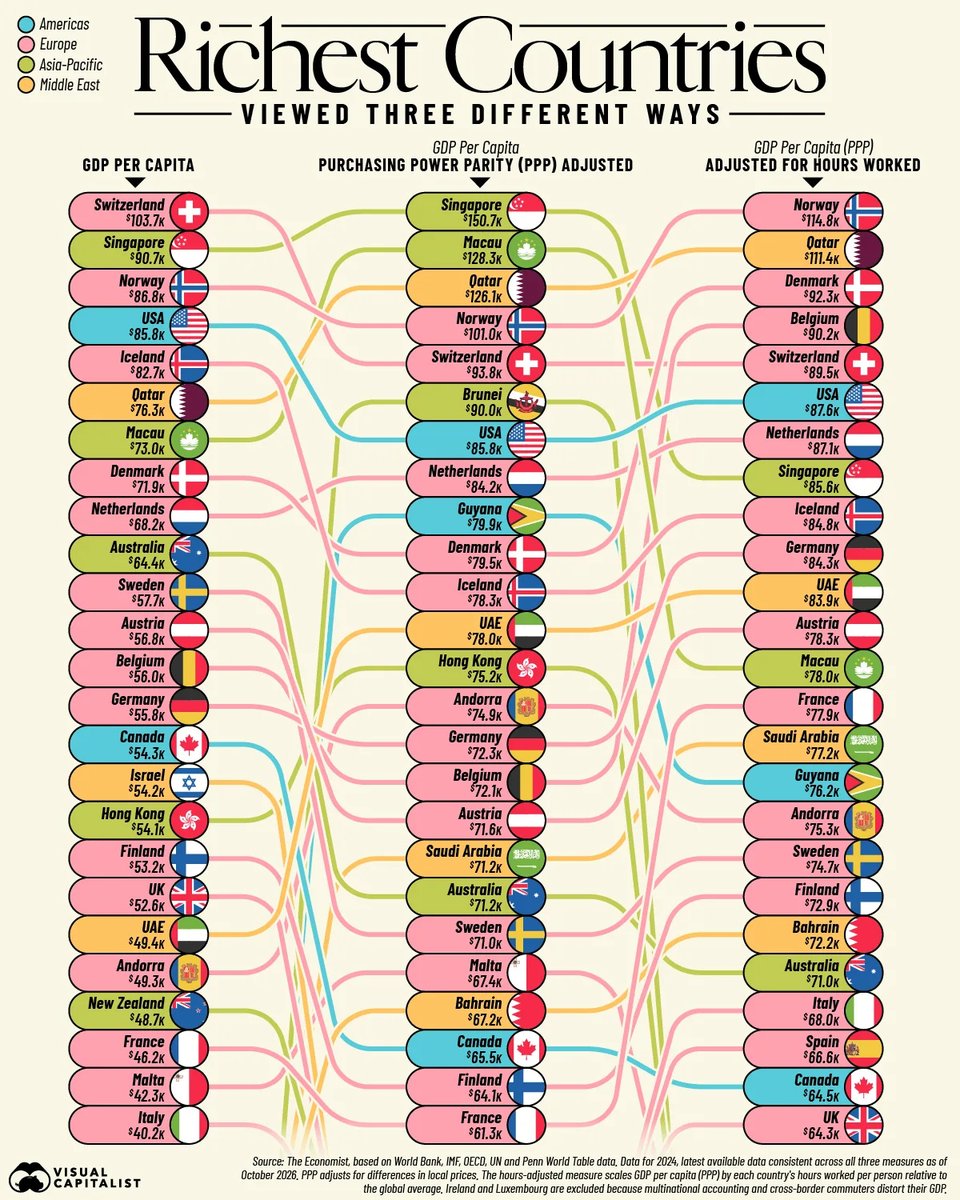
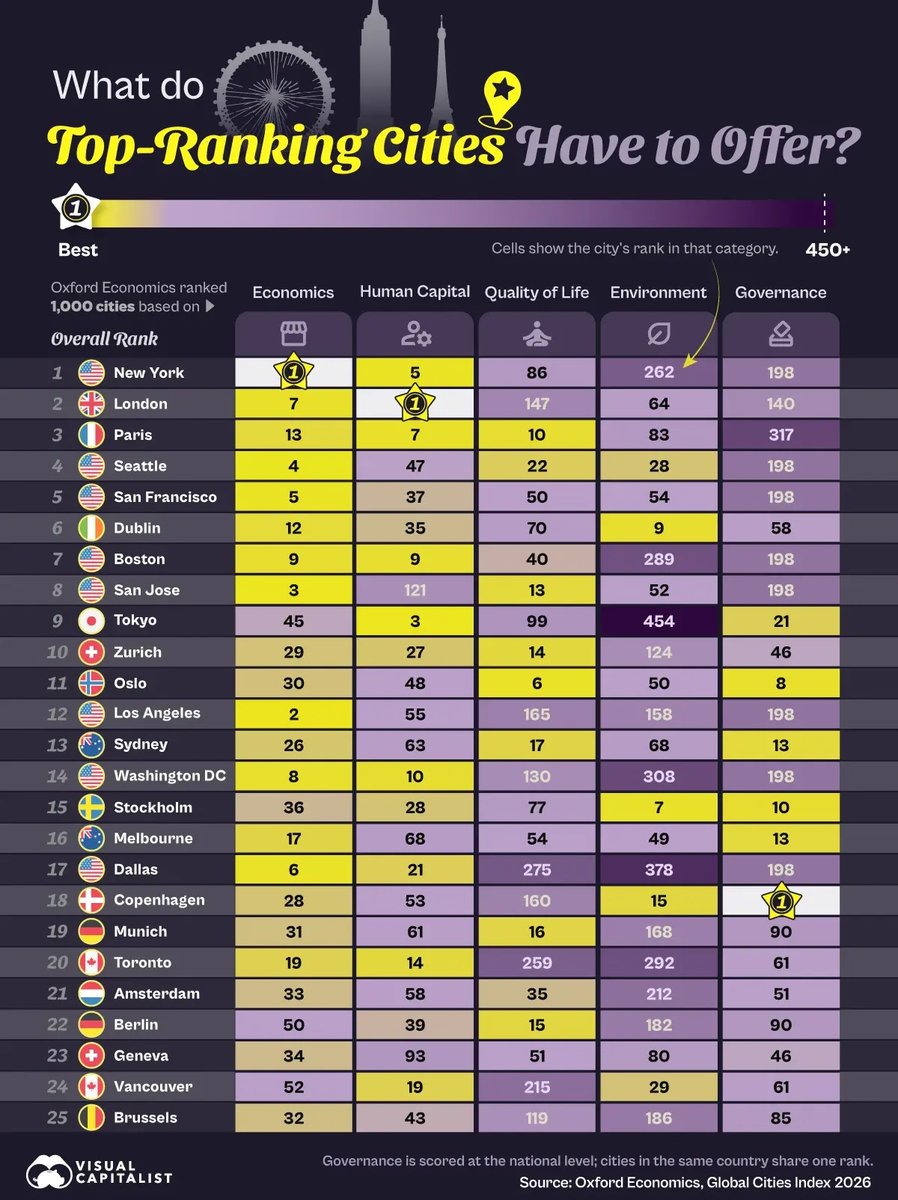
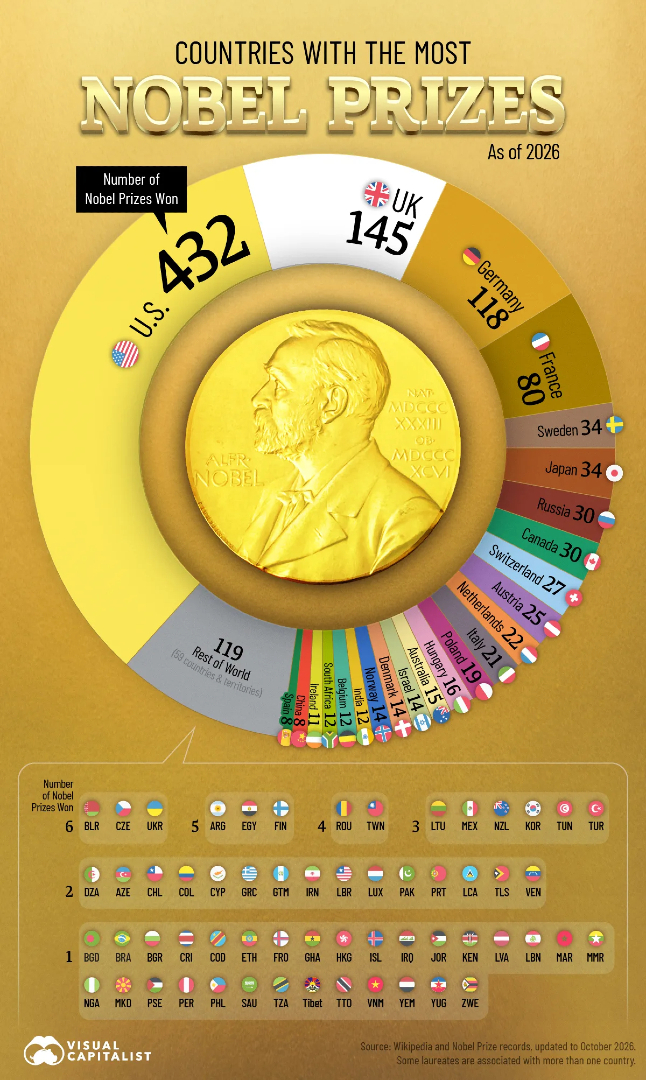
Which cities rank among the world's top 25 in 2026? Which country is actually the richest in the world? And where in Europe are unemployment rates the highest?
Swipe through for some of this week’s featured data stories.
📩 Want the full week in data? Subscribe to Visual Capitalist’s free daily newsletter to get our latest stories and visuals delivered straight to your inbox.
https://t.co/TuuIomLhIm