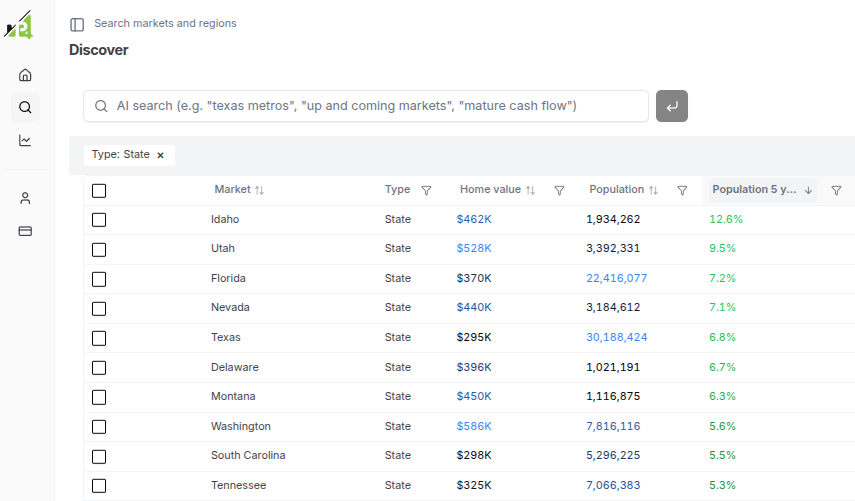
You can now research, discover, and analyze real estate markets entirely through conversation
Property Forecast MCP server turns Claude, ChatGPT, or any AI agent into your real estate research assistant with direct access to the latest data and forecasts
Live now 🚀
Miami seeing some oversupply dynamics playing out right now
13% vacancy rate
15% absorption rate (monthly)
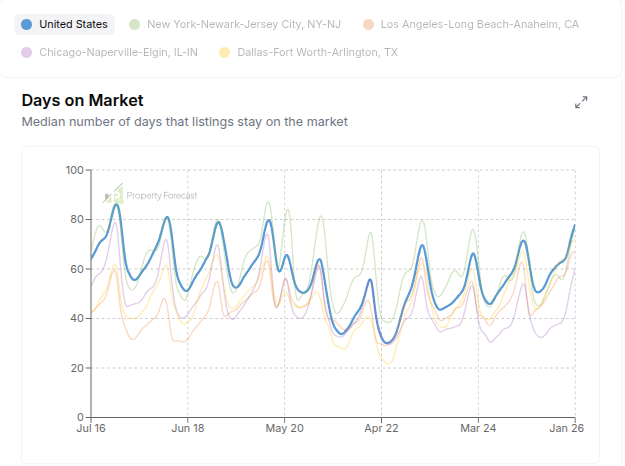
88 days on market (median)
21% of sellers cutting prices
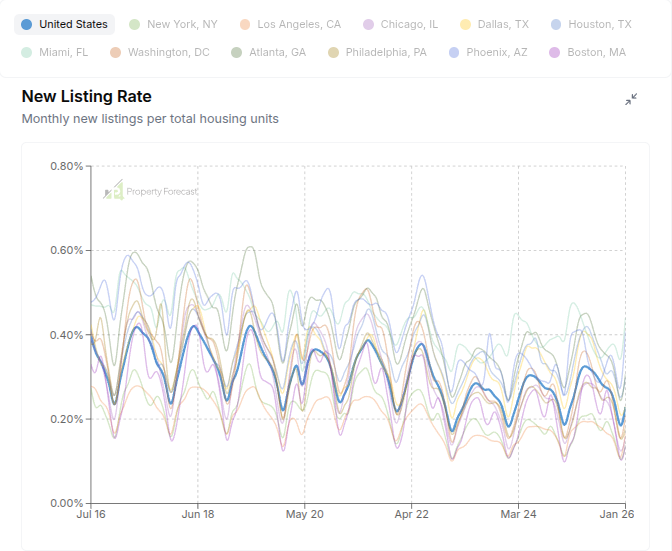
the seasonal floor for new listings is in -- February just turned the corner (as usual)
expect a significant jump in inventory over the next 2-3 months 📈
@AzizSunderji good read! donut theory makes sense.
I bet there's also a median age factor at play looking at these cities, older households want more living space but look to the suburbs
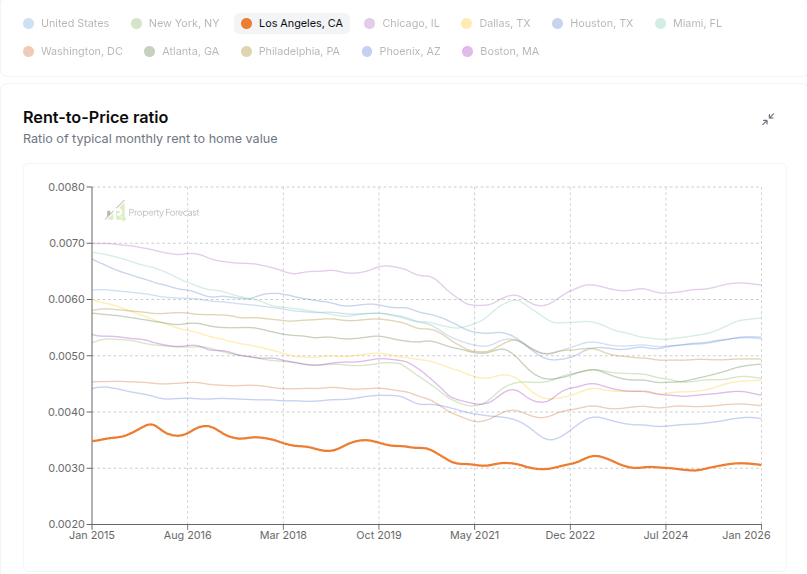
LA has the lowest rent-to-price ratio of any major metro at 0.31% monthly (3.7% annual)
Compare to the US at 0.53% monthly (6.4% annual)
or Chicago at 0.63% monthly (7.6% annual)
If you're buying for cash flow, look to Midwest and Southern markets
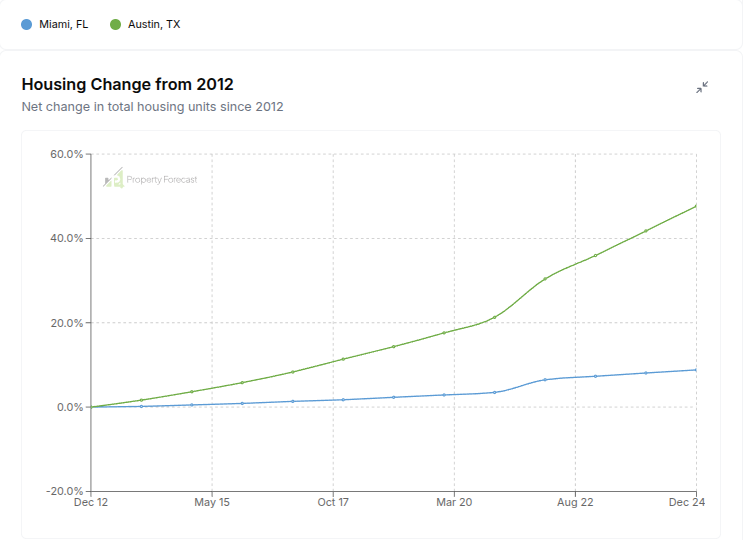
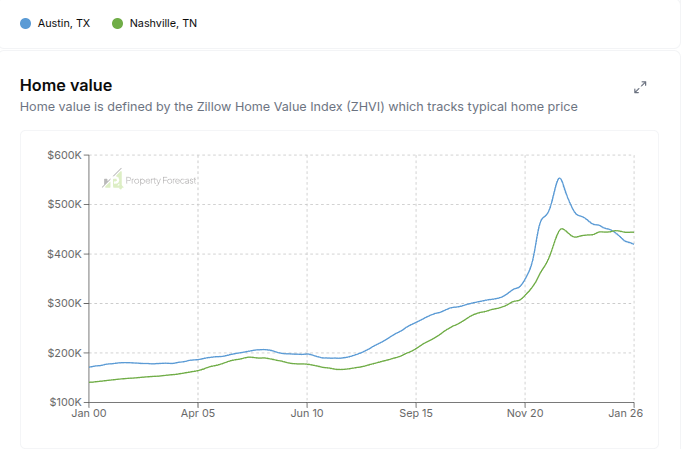
Keep an eye on population vs housing growth in your market - a disconnect is a strong leading indicator of an eventual pullback
Austin: +48% housing, +40% pop (since 2012) ➡️ home values -6.0% YoY
Nashville: +34% housing, +30% pop (since 2012) ➡️ home values -0.3% YoY
Keep an eye on population vs housing growth in your market - a disconnect is a strong leading indicator of an eventual pullback
Austin: +48% housing, +40% pop (since 2012) ➡️ home values -6.0% YoY
Nashville: +34% housing, +30% pop (since 2012) ➡️ home values -0.3% YoY
Some seasonal housing market psychology:
Days on market reliably peaks in January
Price drop rate usually peaks end of summer
The winter slowdown is expected and sellers stay patient, but in the summer there's an implied sense of urgency to close
Some regions already seeing a post-winter rebound:
Atlanta: +6.1% MoM
Boston: +5.3% MoM
Indianapolis: +5.1% MoM
Austin: +2.1% MoM
Dallas: +1.2% MoM
Keep an eye on your local market 👀
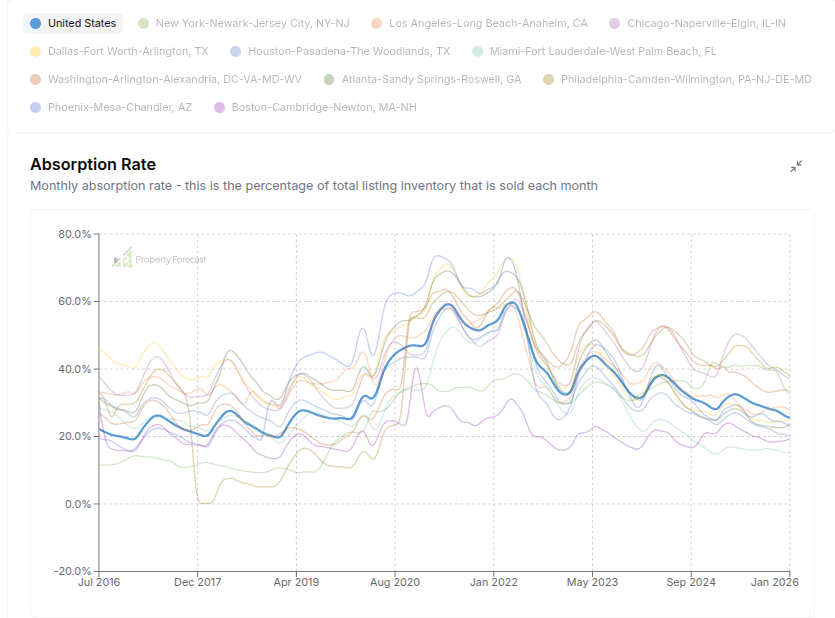
US housing absorption hits 25.5% -- lowest since 2019
Down -2.7% MoM and -7.6% YoY 📉
Watch closely for February's (typical) seasonal rebound. Will be an important signal on outlook for the rest of the year.
Two important nuances here:
1) household size in the US is at an all time low (~2.5) so more demand per capita
2) geographic mismatch between where there is housing surplus and where people actually want to live
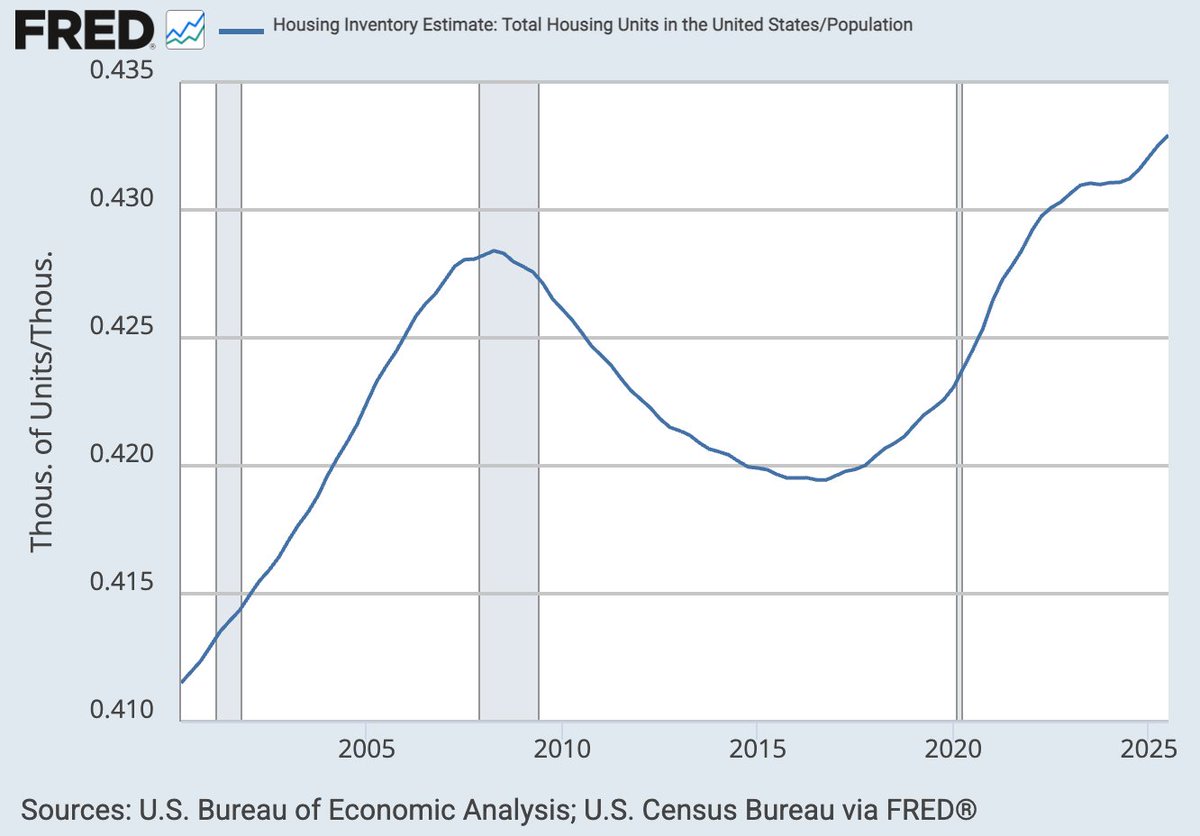
Everyone keeps saying America has a “housing shortage.”
It doesn’t.
Divide total homes by population and you get this:
We’ve never had more housing per person than we do right now.
The problem isn’t supply.
It’s prices.
Digging into the latest @uscensusbureau ACS5 5-year data 👀
Some quick interesting findings...
Population change over the last decade: Houston leads at +24.8% compared to the US overall at +8.3% over the same period
Owner occupied rates have continued downwards in expensive major metros...
But trending sharply upwards in some Sun Belt markets and slightly upwards in the US overall