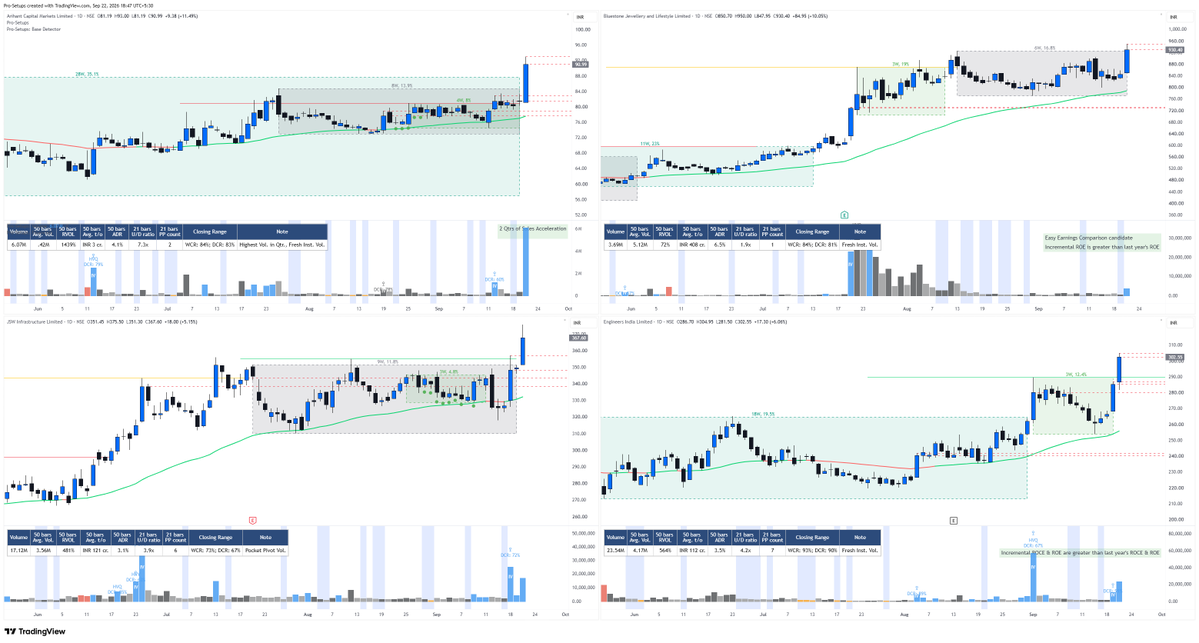
How easy can it be to find stocks breaking out of their bases? Just one click!
And would it not make life even easier if you could visually see the base formation right on the chart?
With Pro-Setups, you can do both! Find the breakouts with a single click and see the base formation directly on the charts.
#BLUESTONE, #ARIHANTCAP, #JSWINFRA, #ENGINERSIN
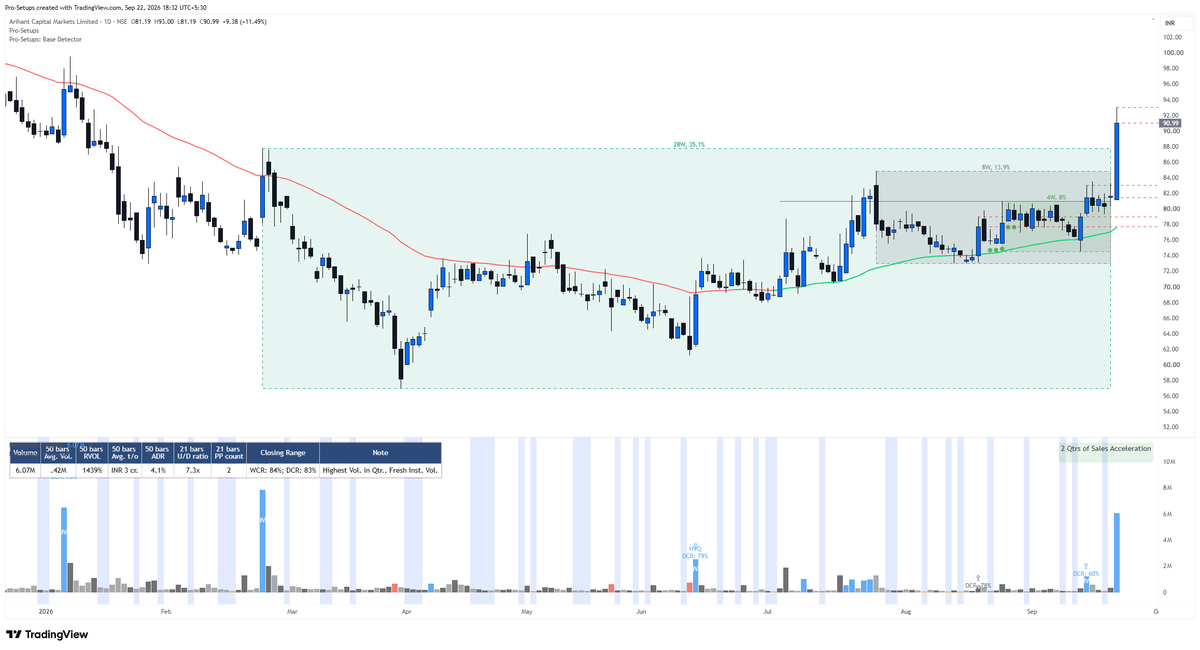
Add #ARIHANTCAP (Arihant Capital Markets Limited) to the list of stocks making base breakouts on high volume today. The intent was visible before today's breakout with multiple fresh institutional volume candles within the base.
Today’s session provided much-needed relief, characterized by a sharp bounce in short-term momentum. However, the move feels like selective participation rather than a broad-based recovery. The index is essentially attempting to stabilize after the volatility seen earlier this week, but it has not yet cleared the overhead supply represented by its declining moving averages. For the recovery to be sustainable, we need to see the "hidden strength" of the broader market manifest in the 50-day EMA breadth, which remains sluggish despite the 186-point jump in Nifty500 today.
Read the full Analysis on https://t.co/ByNzJbpyGp
2026#38: Recovery attempt meets structural resistance
From Sell-off to Recovery -The Market Reclaims Ground, but Has the Trend Really Changed?
Read more in this week's newsletter: https://t.co/mLcL6f65Qq
This newly launched "Insights view" gives a terrific insight into the stocks specifically filtered through my screens!!
This is an awesome feature @ProSetups_ 👏👏👏
On a day like today, it's important to scan for stocks that has put up "Highest Vol in a Year".
On the @ProSetups_ screener dashboard, I applied the following criteria and got about 27 stocks!
Will now pay close attention to these for the coming days.
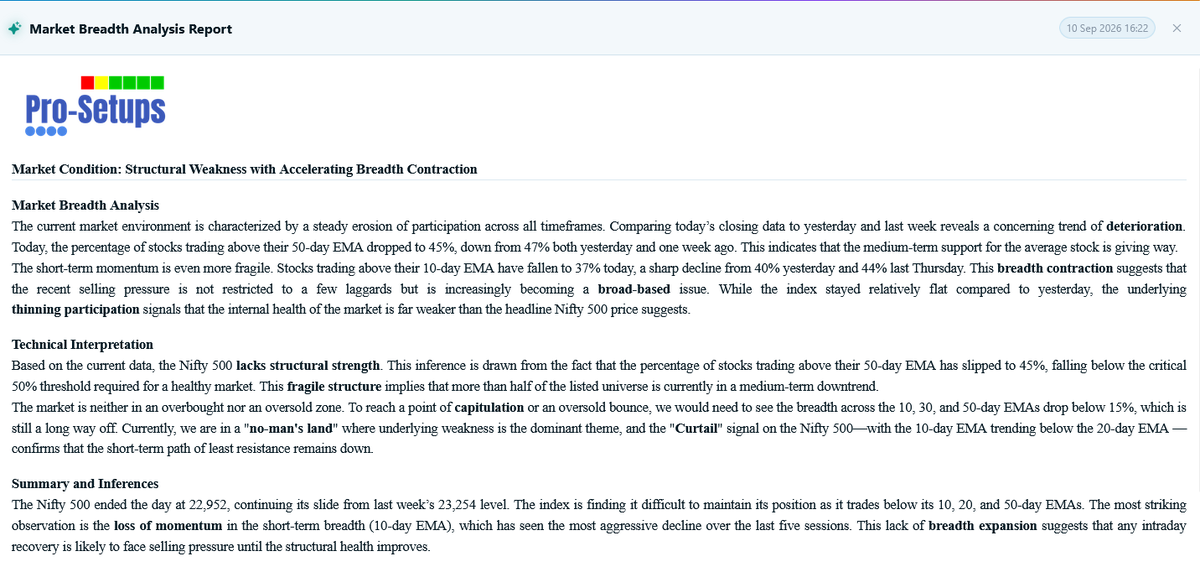
Market Breadth took a steep dip today, with % of stocks above 10, 30 and 50 EMA falling.
Number of stocks with Pocket Pivot Volume also saw a massive dip while the % of stocks falling more than 3% saw a sharp rise.
https://t.co/wDy247dTKn
Good summary of the deteriorating market breadth of CNX500 as of yesterday. While Smallcap index is still holding up, the rest of the pack is witnessing a broadening base of selling.
With Crude at > $105, it's not giving much to hope!!
We discussed Divergence in Market Breadth during our weekend call. Yesterday's MB analysis picked up a similar divergence. It is not an immediate buy signal, but definitely something worth watching and exploring further.
https://t.co/wDy247dTKn
The #base_detector indicator when combined with the rising 50EMA (When the 50EMA is green) and staying invested in the stock until the stock is respecting the structure can be a game changer!
This chart below depicts the same! Share your other charts where you see this playing out !!!
https://t.co/AgKviqeBnD