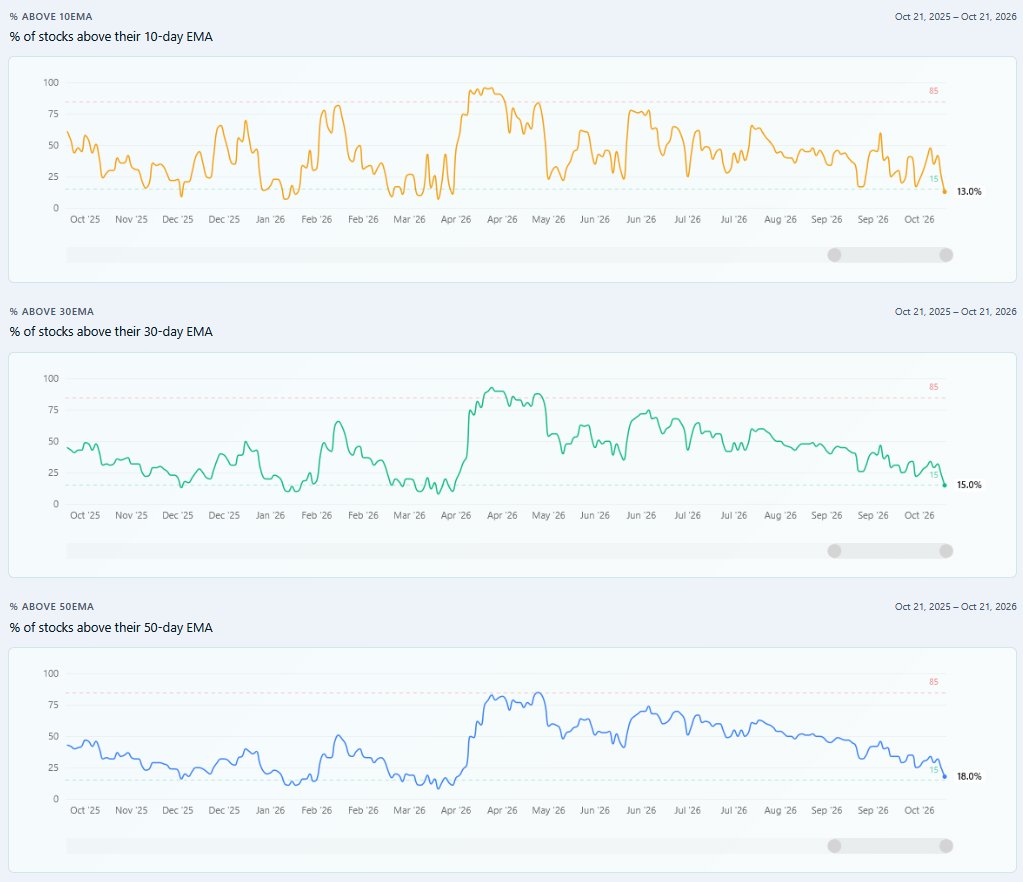
That AI Analysis gives a neat summary of the overall market breadth picture and hence is my first choice to get an overview 👌👌👌
I go through the page subsequently for my own analysis but this summary gives me a good "Top Down" view to begin with!
% of Stocks above 10 days EMA has dropped below 15%,
% of stocks above 30days EMA has dropped to 15%, and
% of stocks above 50 days EMA is now less than 20%..
We are in the oversold region. Need to wait and watch how the market is going to react.
PS: Be aware that in a falling market, stocks can remain oversold for an extended time and in a rising market, stocks can remain overbought for an extended time.
Visit https://t.co/ByNzJbpyGp to get a complete view of the market breadth everyday!
Can also use the "AI Analysis" to get a crisp summary of the market breadth.
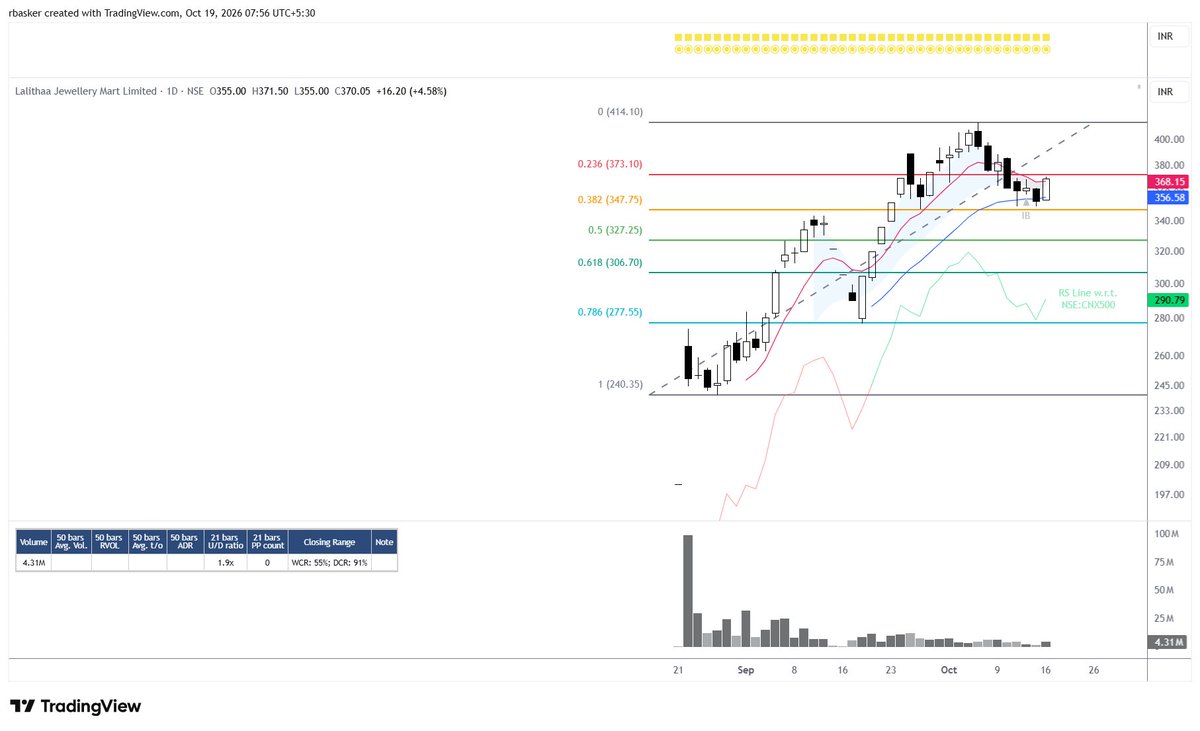
#LALITHAA - Bounce off 21EMA + 38.2% Fibonacci Retracement.
Already have an open trade in #TBZ and in #SKYGOLD and so little hesitant to increase my exposure to this sector but right now, this sector is showing terrific strength.
What's your take ??
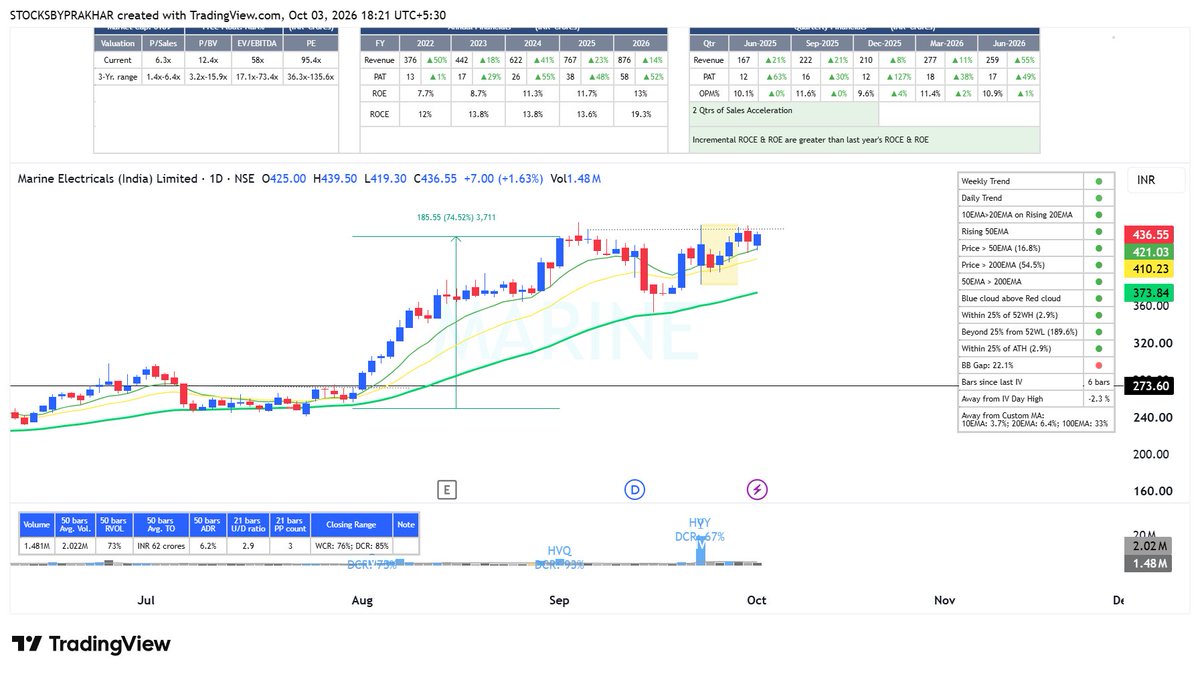
On a day like yesterday when every stock saw massive selling, this base breakout that was identified by the "Base Detector" indicator had plotted it wonderfully!!
The DCR could have been better but we can give the stock some benefit given the larger market reaction.
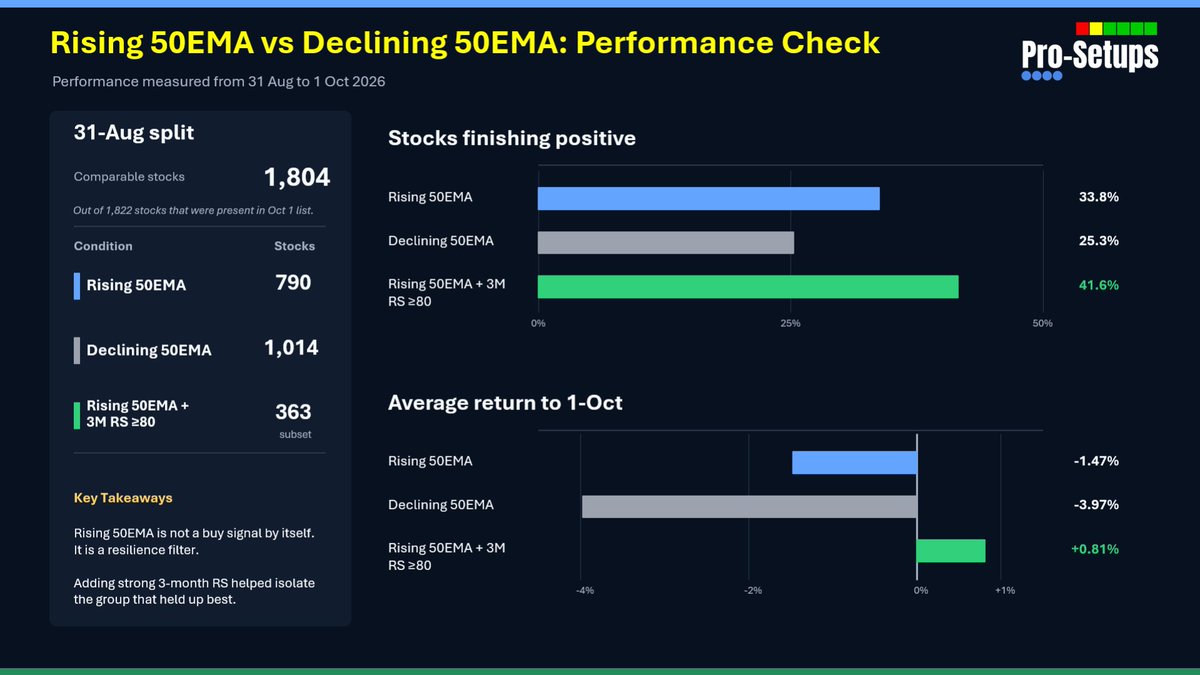
Does a rising 50EMA really matter? We put it to the test.
From 31 Aug to 1 Oct 2026, we compared 1,804 comparable stocks:
▪️Rising 50EMA: 33.8% finished positive, with an average return of -1.47%
▪️Declining 50EMA: Only 25.3% finished positive, with an average return of -3.97%
But the interesting part comes when we added 3-month RS ≥ 80.
Among 363 stocks with a rising 50EMA + strong 3M RS, 41.6% finished positive and the group delivered an average return of +0.81%.
The takeaway?
A rising 50EMA is not a Buy signal by itself. Think of it as a resilience filter. Combine it with strong Relative Strength, and the quality of the group improves significantly.
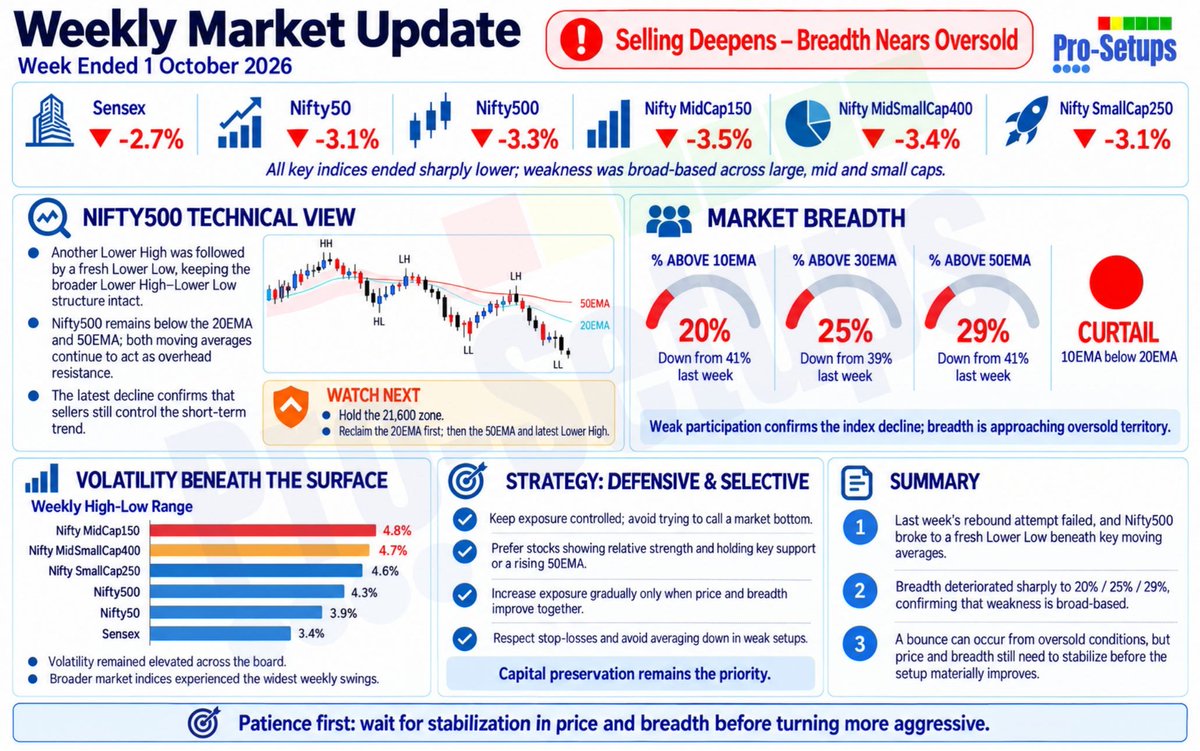
2026#40: Selling Deepens as Nifty500 Breaks to a Lower Low (https://t.co/jFWVdLkhQw)
Broad-based selling pushes the Nifty500 further below key moving averages, while market breadth slides closer to oversold territory.
Read more in this week's newsletter.
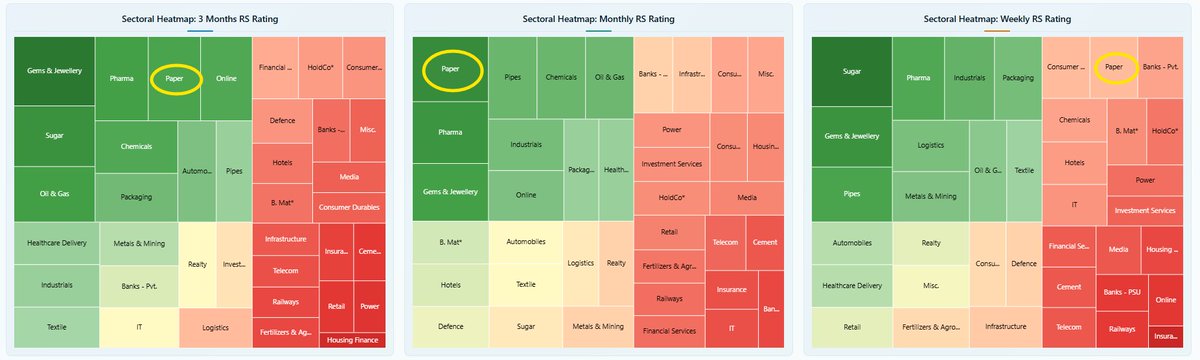
@sjain_13@StocksbyPrakhar Yes, weekly RS of Paper sector has fallen this week. However, a week is a short period, and Paper continues to be strong on both monthly & quarterly timeframes.
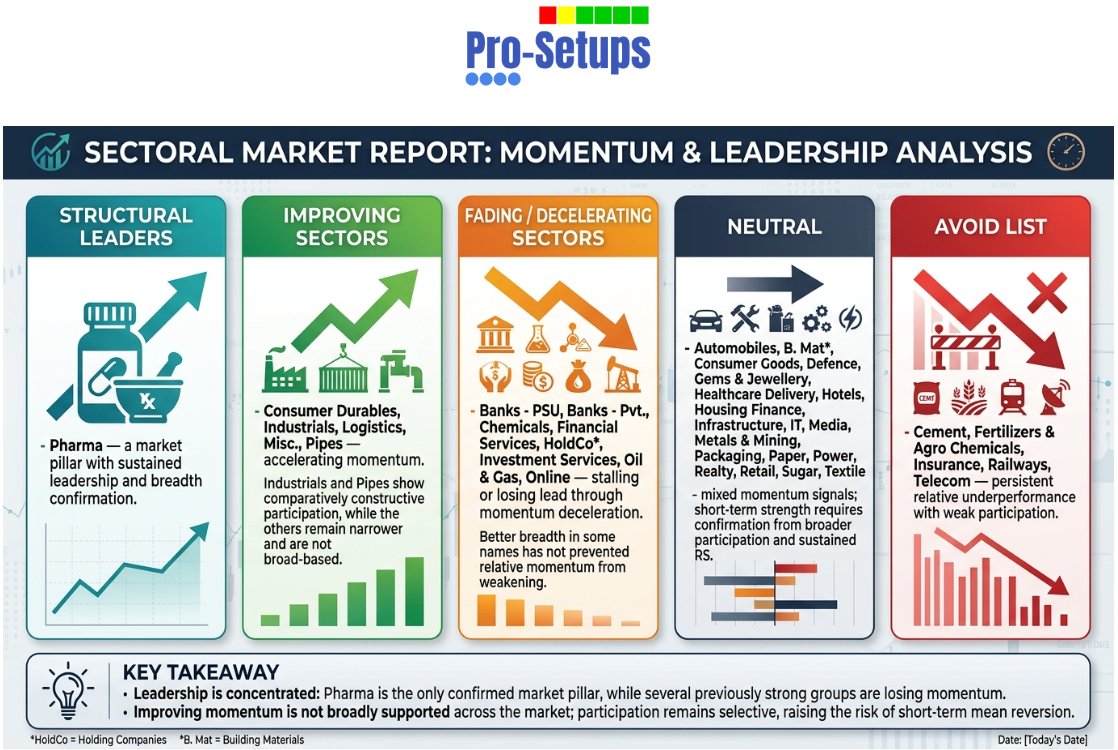
Pipes continue to show constructive participation. Pharma remains the top sector.
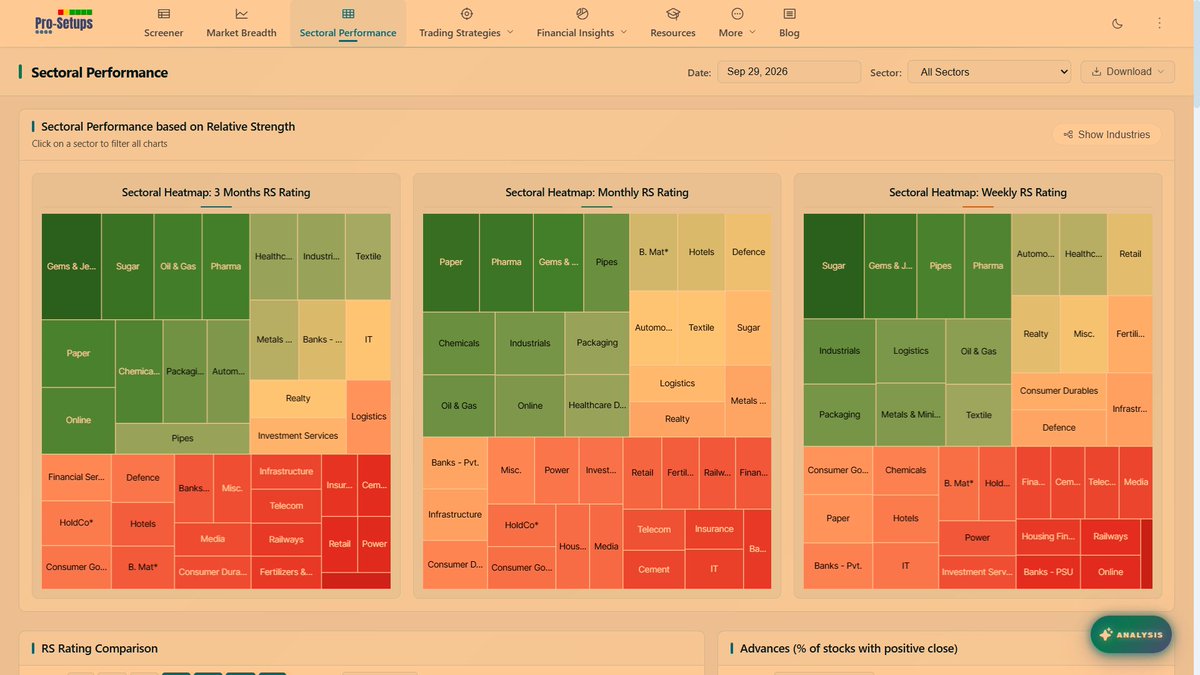
Since market has shown some sign of resisting fall, here is the sectoral performance overview from @ProSetups_
Pipes and Papers: what's cooking in them.
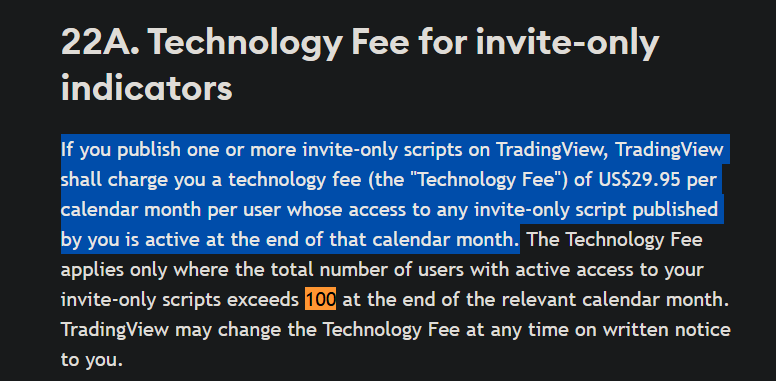
Hundreds of Pro-Setups members upgraded from TradingView’s free plans to paid plans specifically to access our multiple Invite-only indicators.
With this change in their Terms, TradingView is not only pushing us away from their platform, but is also likely to push away the very users who upgraded because of the value they found through our indicators.
TradingView just snuck this into their Terms of Use... Not live yet; no announcement.
Over 100 users on your invite-only script?
$29.95 per user, per month. From you.
This platform is cooked.
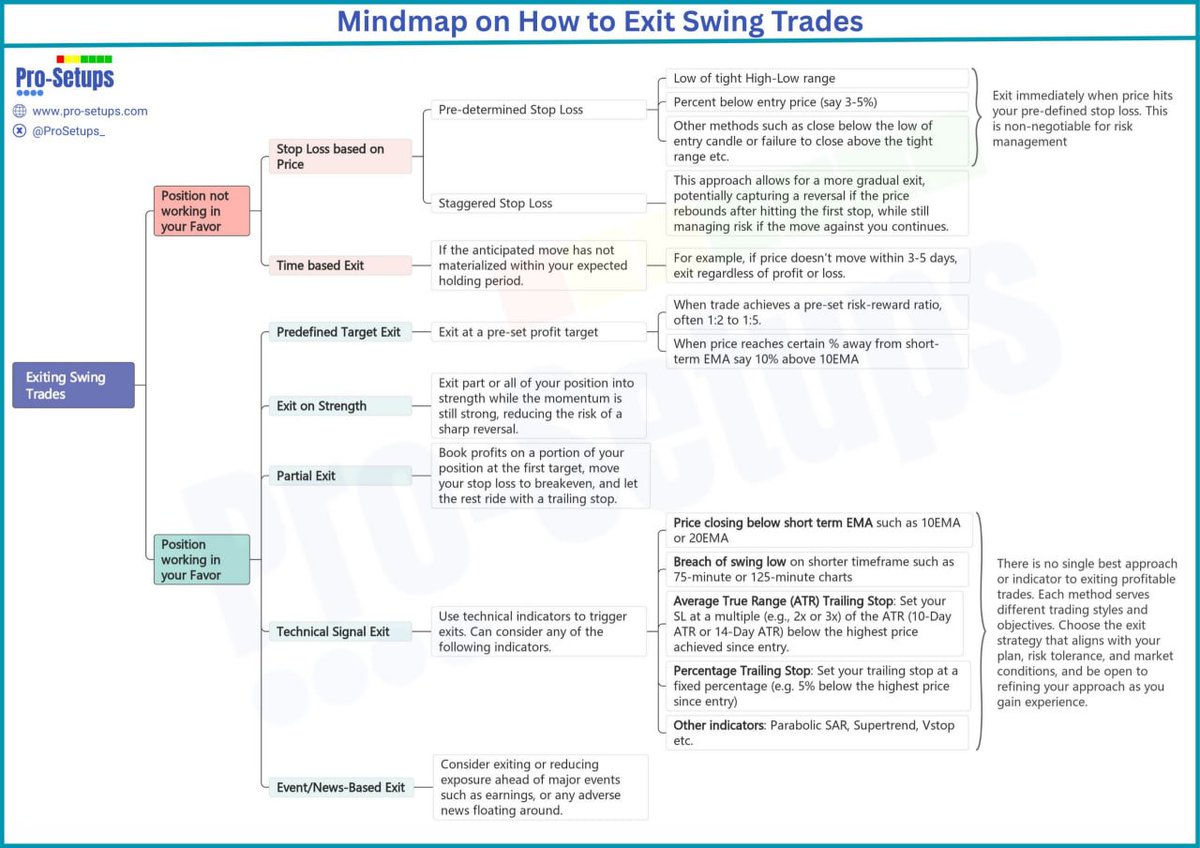
Struggling with Exit Strategies in Swing Trading?
Check out this mindmap for a structured approach to exiting trades.
Interactive version available on: https://t.co/3wYigTtXIf
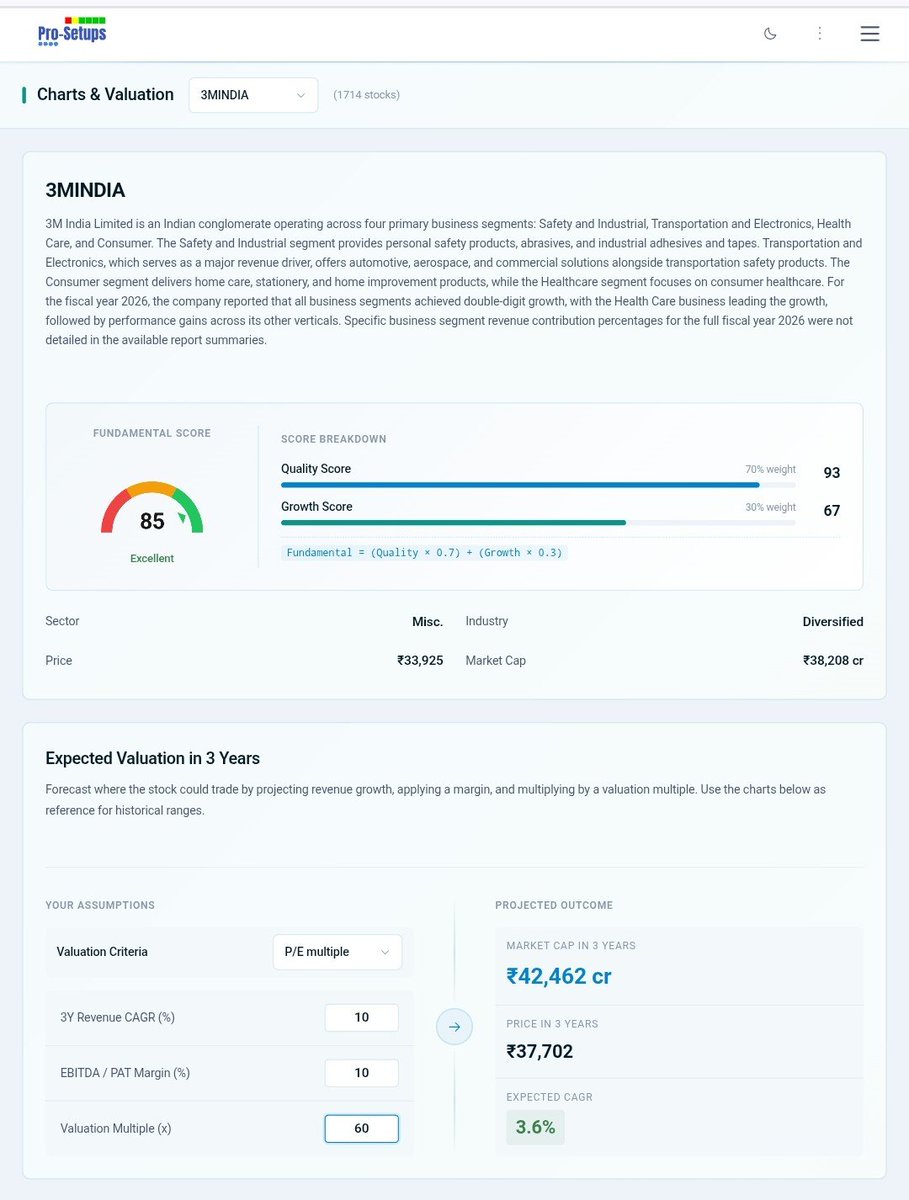
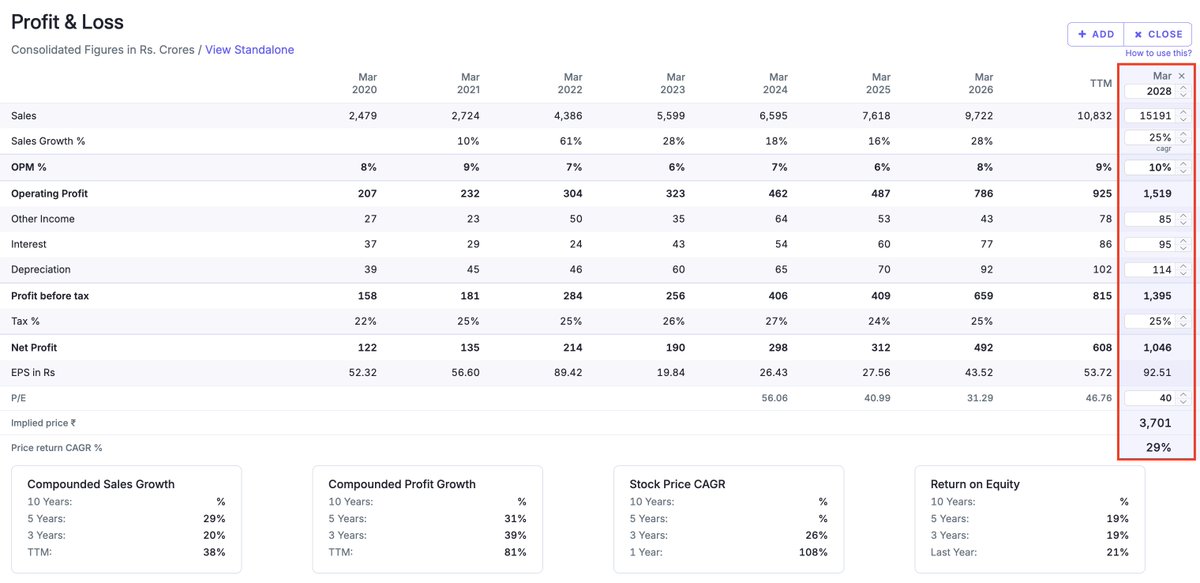
We have this feature in Pro-Setups since over an year. All you need to do is input three key assumptions - Revenue CAGR, EBITDA or PAT Margin & Exit Valuation multiple. You can choose P/BV, P/Sales, EV/EBITDA & P/E criteria.
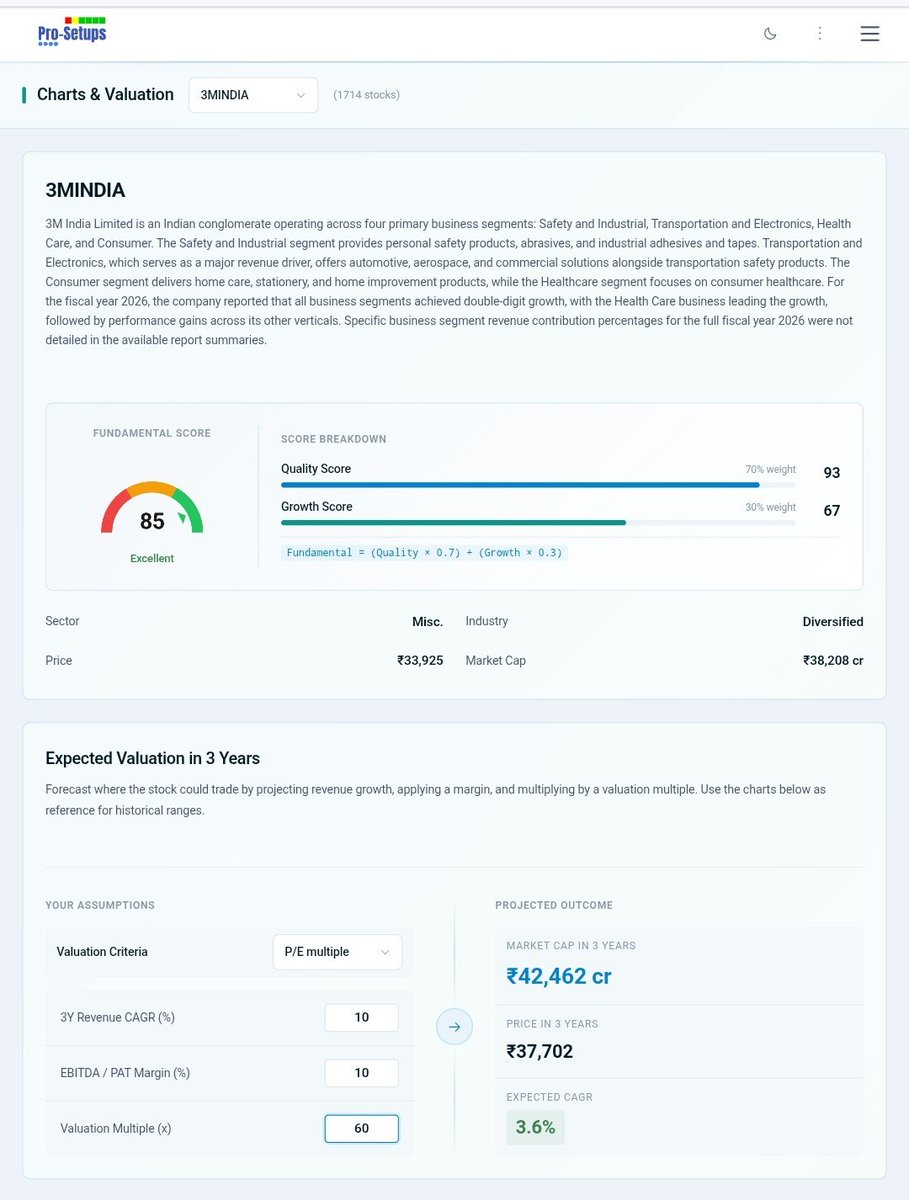
We have this feature in Pro-Setups since over an year. All you need to do is input three key assumptions - Revenue CAGR, EBITDA or PAT Margin & Exit Valuation multiple. You can choose P/BV, P/Sales, EV/EBITDA & P/E criteria.
Solid Update from Screener 🔥
You can now build a basic forward financial model directly inside the P&L itself
Inside the P&L statement, there is now a "My Forecast" tab. Click on it & you can create your own forward estimates directly on Screener.
Just plug in your assumptions for things like:
- Revenue growth
- Operating margins
- Interest & depreciation
- Tax rate
- Exit valuation multiple
Screener then automatically works out the forward earnings, implied valuation & expected return CAGR
I demonstrated it using a simple FY28 example in the screenshot
This is especially useful for quickly testing different scenarios
Screener day by day💹
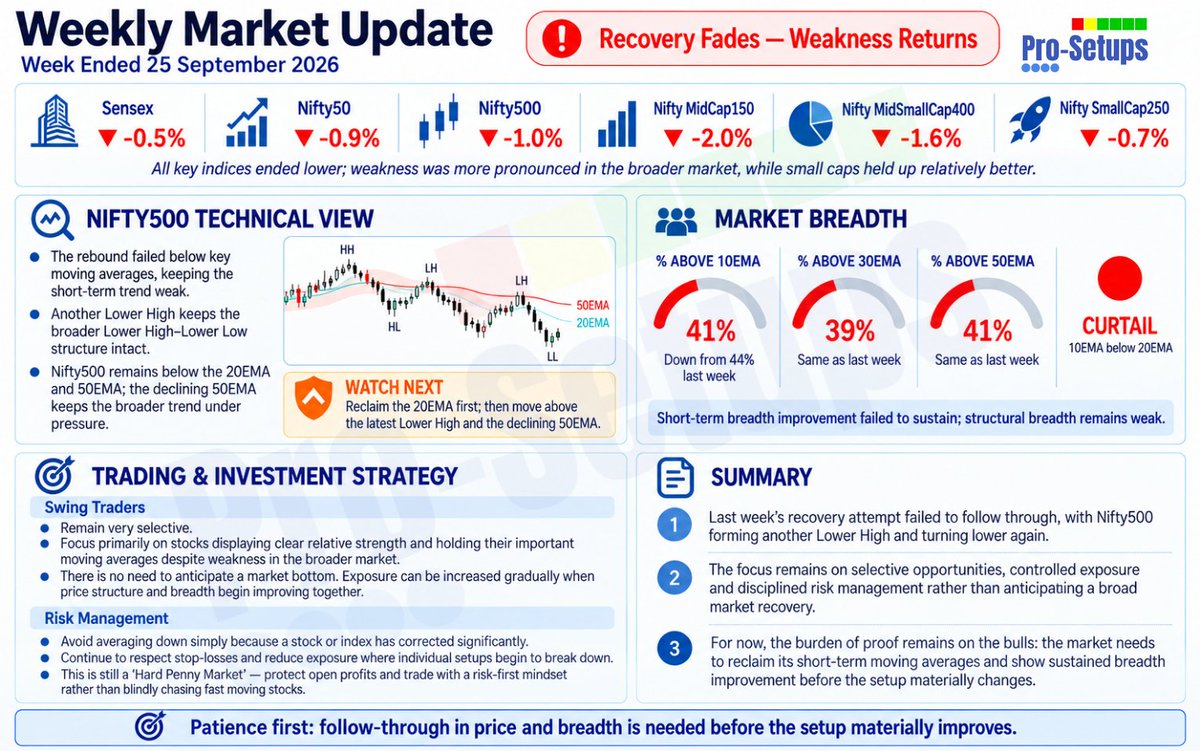
2026#39: Recovery Fades as Weakness Returns
Last week's recovery attempt fails to follow through as Nifty500 turns lower below key moving averages and breadth remains weak.
Read more in this week's newsletter: https://t.co/5hNINrTNna
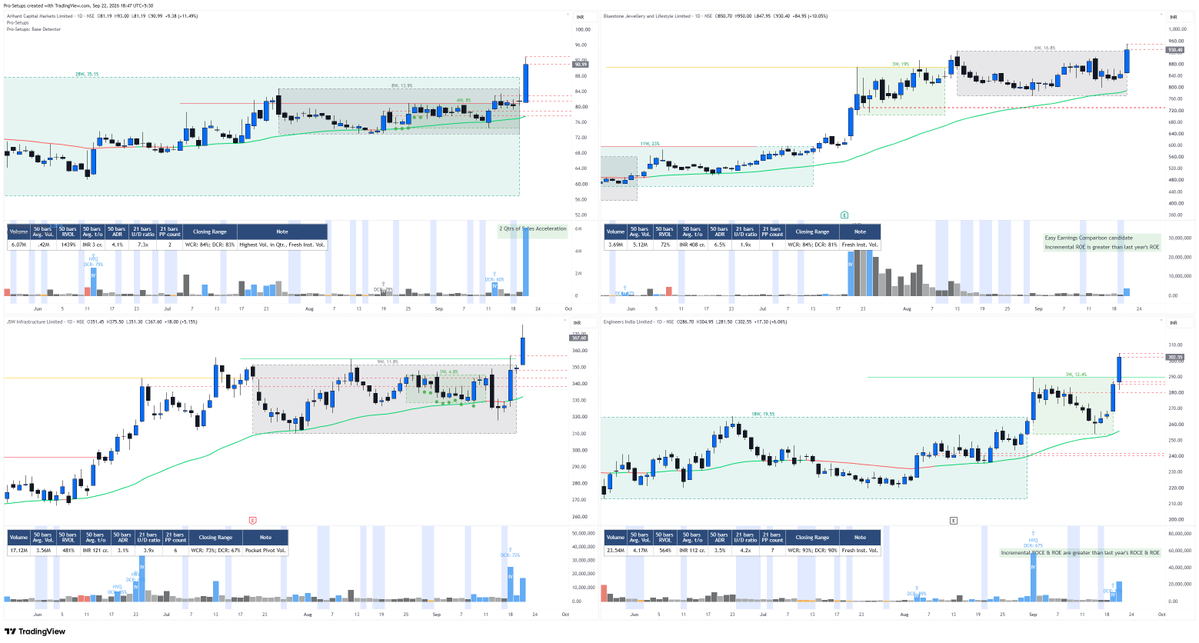
How easy can it be to find stocks breaking out of their bases? Just one click!
And would it not make life even easier if you could visually see the base formation right on the chart?
With Pro-Setups, you can do both! Find the breakouts with a single click and see the base formation directly on the charts.
#BLUESTONE, #ARIHANTCAP, #JSWINFRA, #ENGINERSIN
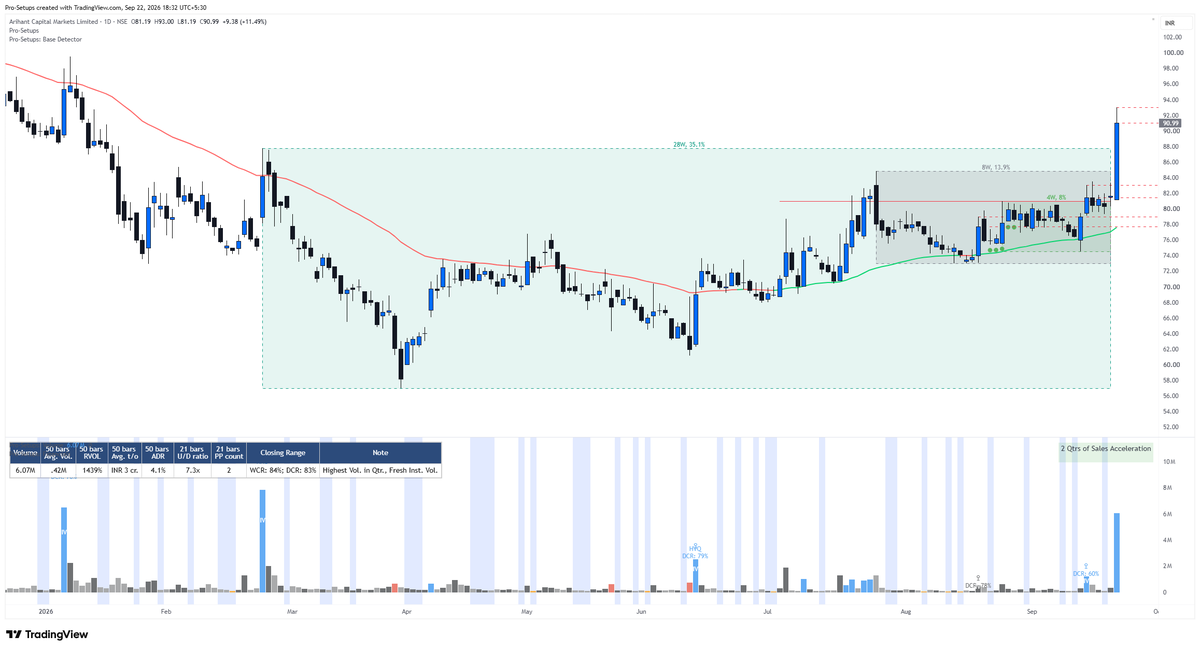
Add #ARIHANTCAP (Arihant Capital Markets Limited) to the list of stocks making base breakouts on high volume today. The intent was visible before today's breakout with multiple fresh institutional volume candles within the base.
Today’s session provided much-needed relief, characterized by a sharp bounce in short-term momentum. However, the move feels like selective participation rather than a broad-based recovery. The index is essentially attempting to stabilize after the volatility seen earlier this week, but it has not yet cleared the overhead supply represented by its declining moving averages. For the recovery to be sustainable, we need to see the "hidden strength" of the broader market manifest in the 50-day EMA breadth, which remains sluggish despite the 186-point jump in Nifty500 today.
Read the full Analysis on https://t.co/ByNzJbpyGp