Massive revenue forcast by HSCL for the EV material & BESS storage 🪫🔋
HSCL has unveiled an ambitious growth roadmap , expanding into cathod & Anode while setting up Long term top line growth target 30,000 cr
✅Current revenue is 4600 cr ---> 30,000 cr ( next 4-5 years)
✅ Massive scale;- targeting 100 GW of total capacity for cathod & anode materiel
✅on track for a 1100 cr PAT guidline by FY28
#HSCL #Cathod #Anode
#SILVER
Silver is also approaching an important support zone!!
A bounce from here would be important to avoid further downside pressure!!
On the upside, a sustained move above the 60–62 zone may confirm the end of the ABCDE correction pattern!!
Until then, this support zone remains the key level to watch!!
#Silver
🏫WALCHANDNAGAR PRICE ACTION
✍️Stock is retesting support and previous resistance that is acting as a support now near 268-275 levels no change in views from my side until major technical breakdown happens will be holding this position
✍️This position is not a swing trade of mine its kept for long term so did my average also little up but its fine currently in little profits but overall monthly timeframe long term chart is good and this is just a pullback after a strong move short term players are booking profits according to me
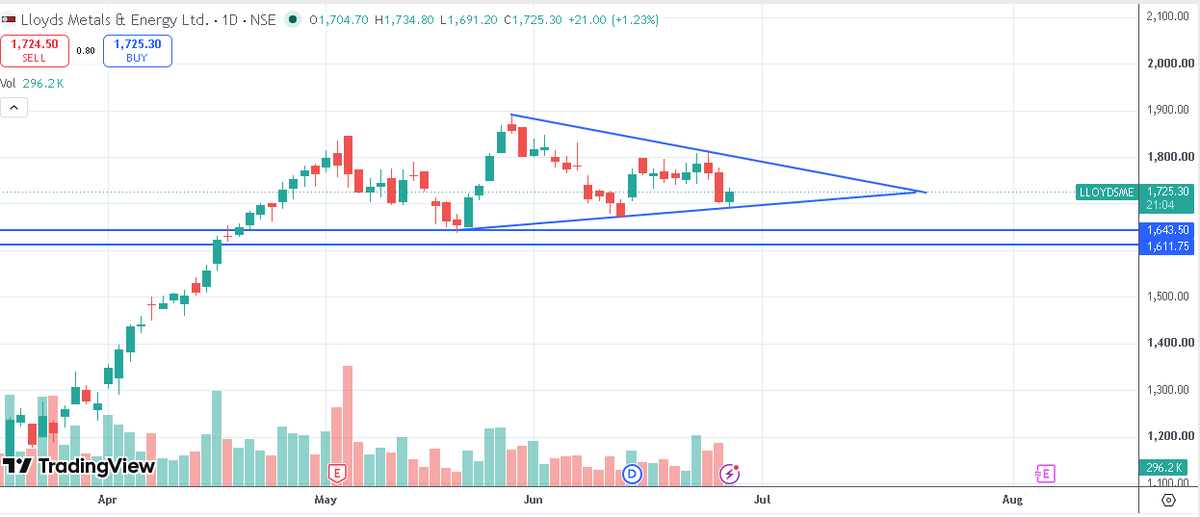
📈 LLOYDS METALS | TRIANGLE FORMATION TO WATCH
Lloyds Metals is currently consolidating inside a symmetrical triangle, where higher lows indicate buyers are gradually stepping in while lower highs show sellers are losing momentum.
✅ Triangle formation nearing its apex
✅ Support zone around ₹1,620–1,645 remains crucial
✅ Volatility is contracting, often preceding a decisive move
A sustained breakout above the triangle could signal the start of the next leg of the trend, while holding the support zone keeps the overall structure healthy.
Educational Note: Triangle formations represent a battle between buyers and sellers. As the range narrows, pressure builds, and the eventual breakout often leads to a strong directional move
Disclosure:Tweet is shared for educational purpose to understand triangle structure no buy/sell recommendations to anyone
Industrial complex
Step up investment Across, ENERGY, Ports & Data center
Nuclear arm looking at target capacity of 10 GW by 2035
Adani ports to handle 1 bn tonne by 2030
Focused to Proxy players
SAIL retesting previous high zone near 170 levels in case it sustains this support as the chart posted below it can reverse but in case it rejects and comes down more we can see some downside till 140
Current Status:No view until metal index shows strength not taking position here
▶️NIFTY METAL VIEW
👉NIFTY METAL at retest support zone which was previously a resistance zone - 12530
👉In case this support is not broken we can see some reversal from here otherwise metals may fall more
👉Checking NALCO,HINDCOPPER,HINDZINC daily RSI is very oversold but yes again oversold does not mean it cannot come down more or will reverse soon it can waste time also for timewise correction or may come down so need to wait for any bullish green candle confirmation for upside
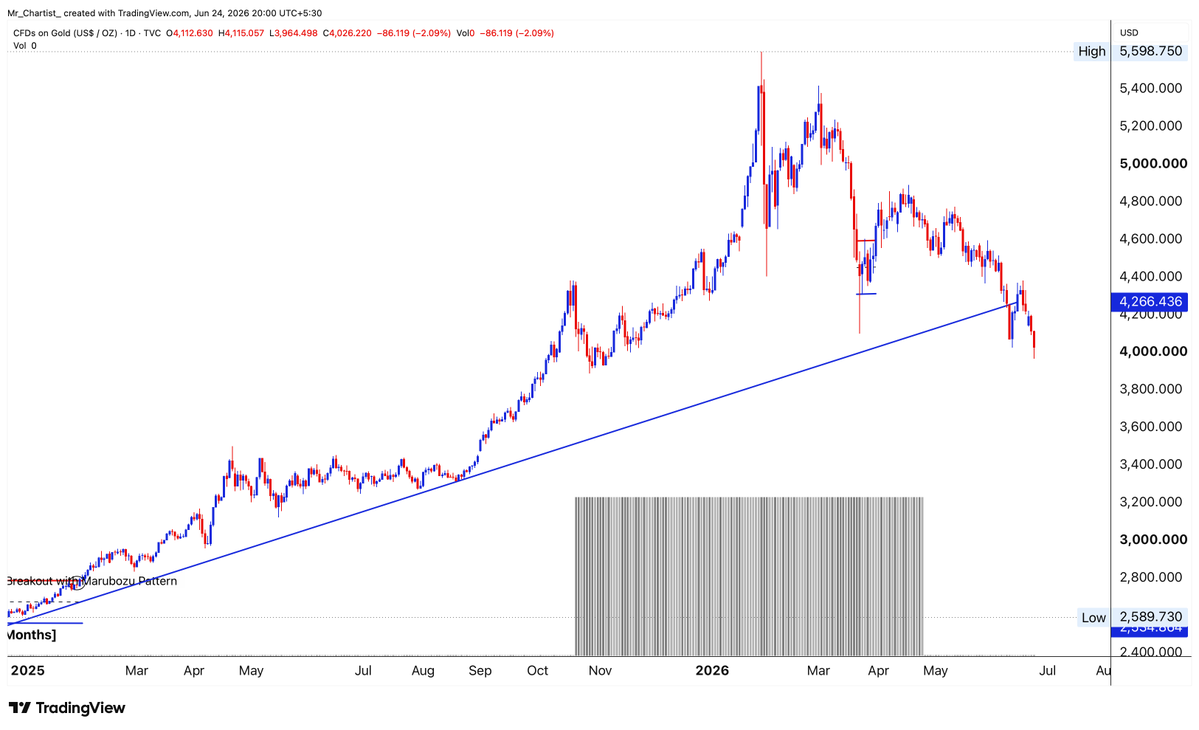
#SILVER
Silver looks like it may retest its 46-year breakout zone.
It has started trading below the weekly 50 EMA, which shows short-term weakness.
Looks like it may first move towards 54 and then try to reverse.
If 54 does not hold, we may see 48–50 levels soon.
We are also nearing half-year closing, and June could possibly witness one of the highest selling-volume months.
But from July onwards, chances of a sharp recovery can’t be ignored.
Keep monitoring.
🚨 I WARNED YOU. A BIG STORM IS COMING!!
Everyone's staring at red numbers this week. Almost nobody's noticing the thing that actually matters: they're all red at the same time.
Korea down 10% in a day. Japan, Europe, US futures all sliding together. Crypto rolling over. Gold off its highs. Different countries, different asset classes, different stories… one direction.
Here's what that means, in plain terms.
In a healthy market, things disagree. Stocks zig, bonds zag, gold does its own thing - because each is pricing its own reality.
But when everything starts moving as one block, that's not a bunch of separate markets anymore. That's a single, giant, leveraged bet wearing a hundred different tickers.
And we've seen what happens when that bet unwinds:
→ 2008 - correlations went to 1, and "safe" and "risky" fell together. Nowhere to hide.
→ 2020 - every screen turned red in the same week, until the Fed flooded the system.
→ Right now - the same convergence is showing up again. Quietly. Across borders.
When markets fuse like this, individual analysis stops working. You're no longer holding "stocks" and "crypto" and "gold." You're holding one trade - and it only takes one shove to move all of it at once.
Look underneath the surface and the pressure is obvious:
→ Bond yields flashing stress
→ Liquidity tightening in the background
→ A Fed boxed into a corner - ease and reflate the bubble, or tighten and crack an overextended market
Either path leads to the same place. Something breaks.
That's the part people miss. A crash doesn't announce itself with one scary headline. It announces itself when correlation goes to one - when the market stops being a market and becomes a single, fragile thing that all moves together.
That's what just started this week.
Most people will call it "a normal pullback" right up until it isn't. I've spent 10 years watching turning points form, and this is exactly how they look from the inside.
When everything moves as one, the only question left is which way and this week, it picked down.
Don't be the last one still treating it like business as usual.