Fri Nov 20. What you get here: before the open each morning, a free email with the SPY and QQQ range options are pricing for the day. After the close I grade it in public, misses included.
The trade journal in the replies runs in a simulated account. Education only, not advice.
https://t.co/vRrCtHvBCN
@3PeaksTrading Good one to have in the back of your mind this week. In your study, did the lows usually land on expiration day itself or in those first few sessions after? I'd guess a lot of it is put hedges rolling off.
@rexstocks Small sample, but it tracks. When the fear gauge is up there, puts get so pricey that a lot of the bad news is already paid for. The hard part is sitting through the weeks in between.
Correction first: Friday's grade said SPY closed inside its 690-725 range. That used the 4:00 PM last trade, 690.91. The settled close was 689.81, a dollar under the bottom of the range. SPY was a miss, same as QQQ (608.45). Week of Nov 16: 6 of 10.
Now the week ahead. From Friday's close, options are pricing SPY for about ±$25 through Friday, roughly 3.7% of price. A week ago the same Friday-expiry number was about 1.5%.
Monday ±$15, Tuesday ±$20, Wednesday ±$23. Wednesday has PCE and GDP at 8:30 AM ET, Thursday is Thanksgiving, and Friday closes at 1 PM.
That's a price tag on the move, not which way. Sun Nov 22 · Education only, not advice.
SPY's max pain for the Nov 27 expiry sits at 737. Friday closed at 689.81. That's $47 away, outside the whole range options are pricing for the week.
The chart shows Friday's close, the ±$28 band the Nov 27 straddle is pricing, the two biggest put piles at 700 and 675, and where max pain lands.
How it works:
→ Max pain: the strike where the most option value would expire worthless if SPY closed there.
→ It's built from open interest, the contracts still open at each strike.
→ It's arithmetic on positions, not a force. Nothing pulls price toward it.
→ Positions don't move when price does, so after a big week max pain lags behind.
Friday's numbers:
→ Nov 27 690 straddle: 15.91 + 12.14 = $28.05. Band 661.76–717.86.
→ Max pain 737 = $47.19 over the close, about 1.7 priced moves (roughly 470 SPX points).
→ Value paid to option holders at a 737 close: ~$55M. At 690: ~$588M.
→ Open: 296,495 puts vs 283,220 calls. Biggest piles 700P 59,116, 675P 47,076, 775C 36,168.
What this tells you:
→ After a $64 drop, max pain still sits closer to the Nov 13 close (754.21) than to Friday's.
→ A max pain number outside the priced band mostly shows how far price has traveled from where positions were built.
→ Distance is the cleaner read: 700 sits 0.36 moves above the close, 675 sits 0.53 below.
Max pain tells you where the positions are, not where price is going.
Weekday mornings I put out the SPY and QQQ ranges and grade them after the bell. Free tier's in my bio.
Delayed quotes at Fri Nov 20 close · Sun Nov 22
Education only.
@InvestmentGuru_ Good way to put it. A high VIX just means protection got expensive, not that the drop has to keep going. It can sit up there for a while even when the market goes sideways.
@TheMarketBishop Holiday weeks usually feel sleepy, but options aren't treating this one that way. The weekly straddle costs about double what it did last week, with fewer sessions to use it.
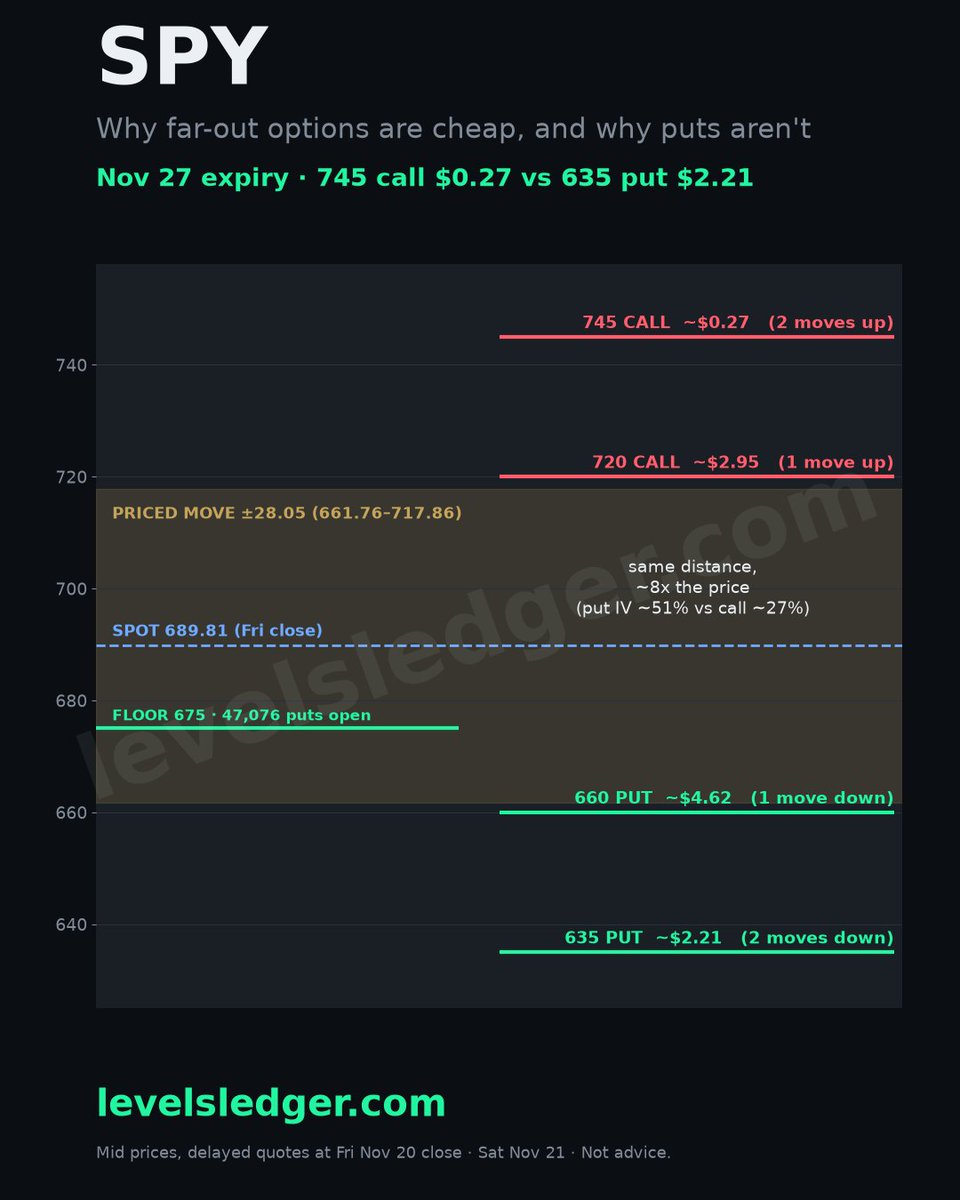
SPY's 745 call for next Friday costs about 27 cents. The 635 put, the same distance below Friday's close, costs $2.21. Same distance, eight times the price.
The chart shows the Nov 27 expiry: Friday's 689.81 close, the ±$28 band options are pricing, and what a call and a put cost one and two moves out.
How it works:
→ Expected move: the at-the-money straddle. Roughly how far the market pays for by expiry.
→ Far out of the money: a strike that needs a bigger move than that to be worth anything at expiry.
→ Cheap means the market prices the trip as unlikely. It's a price on odds, not a bargain.
→ Skew: puts carry higher implied volatility than calls the same distance away. People pay up for protection.
Friday's numbers:
→ Nov 27 690 straddle: 15.91 + 12.14 = $28.05. Band 661.76–717.86.
→ One move out: 720 call ~$2.95, 660 put ~$4.62. About 1.6x.
→ Two moves out: 745 call ~$0.27 (IV ~27%), 635 put ~$2.21 (IV ~51%). About 8x.
What this tells you:
→ The further out you go, the more the price is about fear of the tail and less about distance.
→ After a week where SPY fell 4.8 priced moves, the downside tail is the one people are paying for.
→ A cheap call two moves out isn't on sale, and a pricey put isn't a forecast. Both are odds.
Measure strikes in expected moves and the lopsided pricing jumps out.
Same thing on weekdays: SPY and QQQ levels in the morning, graded after the close. Free tier's in the bio.
Delayed quotes at Fri Nov 20 close · Sat Nov 21
Education only.
@ren_stocks Yeah, there's no obvious trigger like 2020 had, and it still fell like one. Options going into the week were pricing a fraction of this move, so the market didn't see it coming either.
@twinsight_x Divide by 16 is the best quick check there is. People forget it's an average options are charging for, not a forecast, and some days blow right past it.
Last week SPY options priced a move of about $13 either way. SPY fell $64. This week's straddle costs $28, more than double, for a holiday week with three and a half sessions.
The chart shows last week's priced band around the 754.21 close, this week's around Friday's 689.81 close, and the big put piles in the new range.
How it works:
→ Straddle: the at-the-money call plus the put. Its price is roughly the move priced in by that expiry.
→ Realized move: what price actually did.
→ When realized runs far past implied, whoever sold that premium takes the hit and charges more next time.
Friday's numbers:
→ Nov 20 754 straddle priced $13.41 off the Nov 13 close. SPY closed Friday at 689.81, down $64.40. That's 4.8 priced moves.
→ Nov 27 690 straddle: 15.91 + 12.14 = $28.05, 4.1% of the close. Band 661.76–717.86.
→ VIX went from 19.30 to 35.89 over the week.
→ Biggest put pile in the new band: 675, 47,076 open, about half a priced move under spot.
What this tells you:
→ The band is wider because last week broke the old one. It prices what just happened, it doesn't forecast.
→ Thursday is closed and Friday is a half day, so $28 covers fewer hours than usual.
→ A wider band doesn't pick a direction. It says traders are paying up for movement.
A blown range resets the price of the next one. Measure this week's levels against $28, not $13.
Every weekday morning I put out the SPY and QQQ priced range and grade it after the close. Free tier's in the bio.
Delayed quotes at Fri Nov 20 close · Sat Nov 21
Education only.
@gabz_investing That's the part that gets people. A third of the index moving together means you're a lot less spread out than "500 companies" makes it sound.
@business@JonathanJLevin@opinion The stock wealth leg is the one that moves fastest. A week like this hits how people feel about spending way before it shows up in the data.
SPY hung right on the bottom of its range today. QQQ didn't even get that close — it broke well below its own. That's a hit and a miss.
Education only.
Fri Nov 20. SPY is sitting about 1% under yesterday's close before the bell, and options are pricing roughly $13 either way. Not a sleepy Friday.
Options-implied ranges off the premarket price: SPY 690 to 725, QQQ 617 to 649. That's what options are pricing, not where price goes. Education only.
How that range gets built from the straddle, on one free 2-page cheat sheet:
https://t.co/tpqTzZNNvM