Gave my franchisor an earful today about how they over promised sales with limited support, ballooned the build out requirements, and now have stuck franchisees with dozens of units that don't work.
I tried using ChatGPT+ to create a chart of what my restaurant's daily sales pattern looks like for a typical Monday. I gave it a CSV with each order's timestamp and $ value.
...after a lot of errors and frustration, I'm back in Excel making the charts myself.
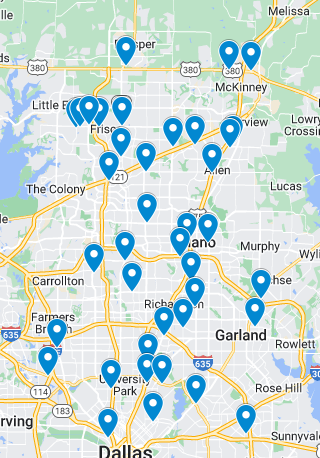
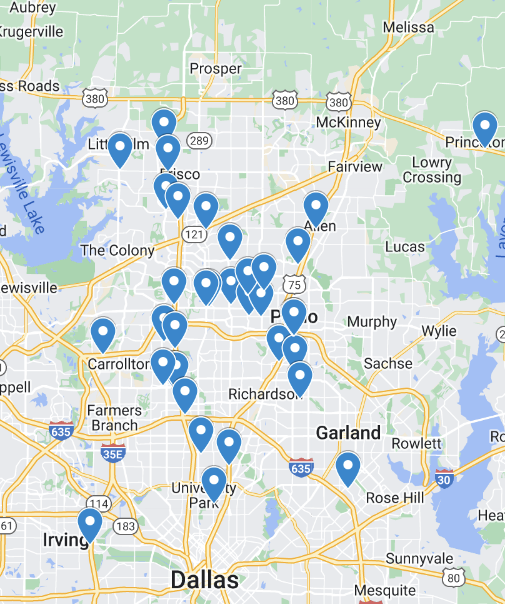
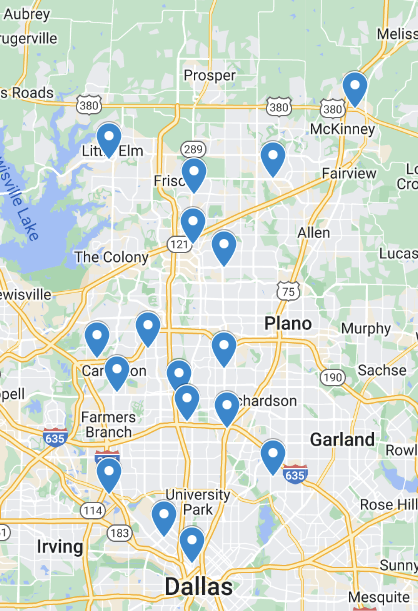
A couple dozen more bit the bullet this holiday season.
Monthly reports are available for your metro region - drop me a DM if you're interested! RE developers, RE investment firms, and growing restaurant franchises looking for 2nd gen space are welcome!
More to come soon.
My franchise does not do much sales reporting and I wish they would.
Do other franchises share trends?
Things like:
Weekly or monthly Sales YoY by location type
Sales mix changes
Volume/price trends
It is also worth noting:
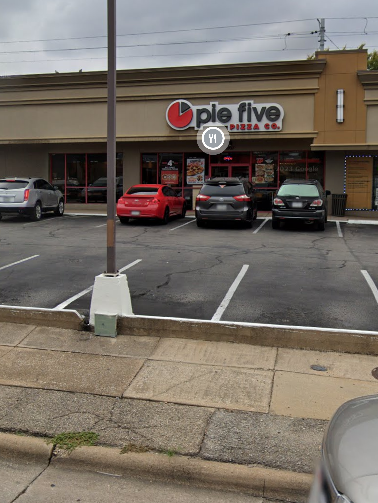
Restaurants do not close only for bad reasons. Sometimes, they put a couple kids through college, created a nest egg, and it is simply time to retire.