I have a problem I cannot solve from the inside ~ help me solve it.
I have been doing this so long that I forget what reads as valuable from the outside. The $10,000 day screenshot reads as cringe to me, but those are the posts that pull the most traction. So there is a gap between what feels honest to share and what the audience actually wants to see, and I would rather close it with your input than keep guessing at it.
What do you want more of?
~Platform walkthroughs of how Vera and Greg work under the hood?
~Trade reviews where the database called the level and we walk the tape?
~Daily P&L because it is normal for us and you want the receipts?
~Mindset and psychology breakdowns?
~Something none of us have thought of yet?
The systems have been running and measured for a long time. The accuracy part is settled. The part that is not settled is how to reach the people who would actually use them. The goal here is a sustainable community, not viral moments ~ and the read from the people already in the room is worth more than any algorithm signal.
Tell us what format earns your time. We will build toward it.
https://t.co/kxh5s9HmRq #FinTwit #TradingCommunity #QuantCyphr
Price is near highs, but the read is not clean ~
Momentum is fading at the same time breadth is sitting at 56.8%.
That is not full-investment conviction.
Greg’s July map has the key zone clear:
Resistance: 7,589.58 to 7,592.65
Floor: 7,501.48
Upside target: 8,000
Downside risk: 7,200
The mid-7550 rebound matters, but the report flags it as thin-volume holiday tape, not proof of renewed demand.
So the job is not to chase the high.
The job is to respect the range, watch whether resistance actually breaks, and see if breadth confirms or fades.
FOMC minutes on July 8th are the next real catalyst.
Structure before reaction.
#QuantCyphr #ES #FuturesTrading
Market Outlook: The Dollar Reversal ~ 100 to 110 and the Shortage Loop.
The consensus call has been de-dollarization ~ that the dollar's global role is fading, that the currency is structurally weaker, that the Petrodollar era is closing without a replacement. Today's image takes the other side, and it does it with a mechanism, not a slogan. The US is moving into what theis labeled a "WWII Playbook": the defense industrial base as the engine, global instability as the fuel, and a dollar shortage as the exhaust. The trade is not that the dollar is strong. The trade is that the dollar is being made scarce.
The technical side is the fastest to read. DXY fell below 100 in 2025, then reclaimed it, and the same 100 line that had been support flipped into support again ~ old resistance becoming new support is the cleanest chart signature of a completed reversal. The database's own target is a breakout toward 110, and the framing goes beyond price. Wall Street ~ Goldman Sachs, Chase ~ has shifted from de-dollarization to a "Dollar Bullish" outlook by the image's own labeling. When the sell side shifts its call on the currency after years of the opposite view, that is a signal the mechanism, not just the tape, has changed.
The mechanism is the analytical center of the page. The image describes a loop: global instability forces allied nations to spend heavily on defense and rebuilding. To rearm, those nations must buy from the US industrial base. To buy from the US, they must acquire US dollars. Every unit of foreign defense spending becomes a unit of dollar demand. That is not a currency thesis fueled by yield differentials or Fed policy. That is a currency thesis fueled by the defense trade balance. The Petrodollar recycled current account demand into US paper. This loop recycles rearmament demand into US paper. Same destination, different pipe.
The catch is the two sided read. A dollar shortage built on rearmament demand is a policy dependent trade, not a market organic one ~ the day the demand engine cools, so does the tape. And a stronger dollar tightens conditions for every dollar borrower outside the US, which is a shock the emerging markets in the swap line scramble are already showing. The DXY breakout is the thesis. The shortage loop is the mechanism. The cost is the collateral pressure on everyone who owes in dollars they do not print. The trade is real. The bill is real too.
https://t.co/kxh5s9HmRq #Macro #Geopolitics #Yields #QuantCyphr
Market Outlook: Market Attrition ~ The July Distribution Window.
Today's image labels the tape "stuck rather than strong" and frames the market as entering a distribution phase where surface level index stability masks internal decay. Q3 still carries macro productivity as a tailwind. But a top heavy divergence in the breadth stack points at a multi week reversal toward significant downside targets, and the database names the window: the mid to back half of July. The index looks stable. Underneath, the participation is thinning through the hierarchy.
The tactical framework converts the internal read into price targets. The July weakness window is named for the mid to back half of the month, with the database's strategic alignment pointing at a downside resolution. The S&P target range is defined explicitly: 7,200 as the minimum expectation, 7,000 as the possible test at the 200 day moving average. That is a full range map ~ not one number to defend, a two number path stacked between the current tape and the structural floor.
The ES make or break channel sets the immediate trigger. Above 7,553.70 delays the thesis. Below 7,511.81 confirms the downside. The channel is tight, which is why the July 2 payrolls print carries the weight it does: Nonfarm Payrolls at 130K forecast against 172K prior, Private Payrolls at 56K forecast against 120K prior, Unemployment at 4.3% both forecast and prior. Two labor prints softening on the same day inside a tight ES channel is the setup the database staged the whole page around.
Trade the channel. Respect the 7,200 to 7,000 range as the July path. Watch the payrolls prints as the confirmation event. Sector strong. Symbol soft. The line between them decides the tape.
https://t.co/kxh5s9HmRq #Macro #SPX #Futures #Markets #QuantCyphr
As with anything measurable in life, success usually comes from going through the grindstone and coming out the other side charred, chewed up, and beaten down.
That pain is not always the cost.
Sometimes it is the process that finally shapes you into someone who can handle it.
The amount of traders I see with real potential who still refuse to downsize honestly confounds me.
They can read the tape.
They can spot the setup.
They can explain the structure.
Then they size like they’re trying to prove something to the market.
That’s not conviction.
That’s ego wearing a trading plan costume.
If you can’t trade small, you probably can’t trade big.
You’re just using size to hide the fact that you don’t trust your own process yet.
Market Outlook: Quarterly Digestion ~ Structural Uptrend, Tactical Consolidation.
Today's image reframes the recent softness. The market is digesting gains from its strongest quarter since 2020 ~ the S&P and NASDAQ both up over 14% on the quarter ~ and the database is explicit that the short-term defensiveness is digestion, not distribution. Structural long term trend remains upward. Balanced breadth and constructive small and mid cap leadership are what carries the read. The pullback is the exhaust of a strong quarter, not the reversal of the trend that produced it.
The structural health side has the evidence. 83.3% of sectors sit in long territory ~ 10 of 12 ~ which the database labels broad investment participation despite the short-term consolidation. Current profit taking is framed as healthy backfilling rather than a breakdown of the upward trend, and the cap-stack cards confirm the same read at the size dimension: Russell 2000 up 21.9% year to date and leading, Mid Cap up 16.6% and constructive, NASDAQ up 12.8% and consolidating. The rotation is not just from tech to everything else. It is up the strength curve with the small caps leading, the mid caps supporting, and the mega cap heavy NASDAQ at the back digesting. That is broadening, not weakening.
The tactical framework sets the near-term test. ES sits inside a defined range from 7,518.77 to 7,565.23 ~ the band the market is trading within. A daily close outside the range defines the next move: above 7,565.23 opens 7,591 to the upside, below 7,518.77 opens 7,496 to the downside. The 60.8% group strength reading sits above the 42% group stability threshold, which the image labels the liquidation trigger line. Well above, not near ~ the structural cushion is intact even as the tactical range compresses. Range-bound at the price level, well-supported at the breadth level.
The catalyst calendar is compressed by the holiday. Focus shifts to Wednesday's ADP data and Thursday night's critical intermediate model refresh ~ two prints that will resolve the range one way or the other before the July 4 window closes. The database is not asking you to trade the digestion. It is telling you where the range breaks and which prints break it. Quarterly gains at the back. Structural cushion in place. Two-catalyst window in front. The setup is the read.
Trade the range. Respect the floor as the real cushion, not the price band. Watch ADP and the model refresh as the two catalyst window. The uptrend is intact. The digestion is the price of it.
https://t.co/kxh5s9HmRq #Macro #SPX #Futures #Markets #QuantCyphr
@TradeSniperSara Be kind to yourself. This business can be very rough on your emotional state. The best thing you can do is be kind and accepting to yourself, reset, and come back fresh spirited the next day.
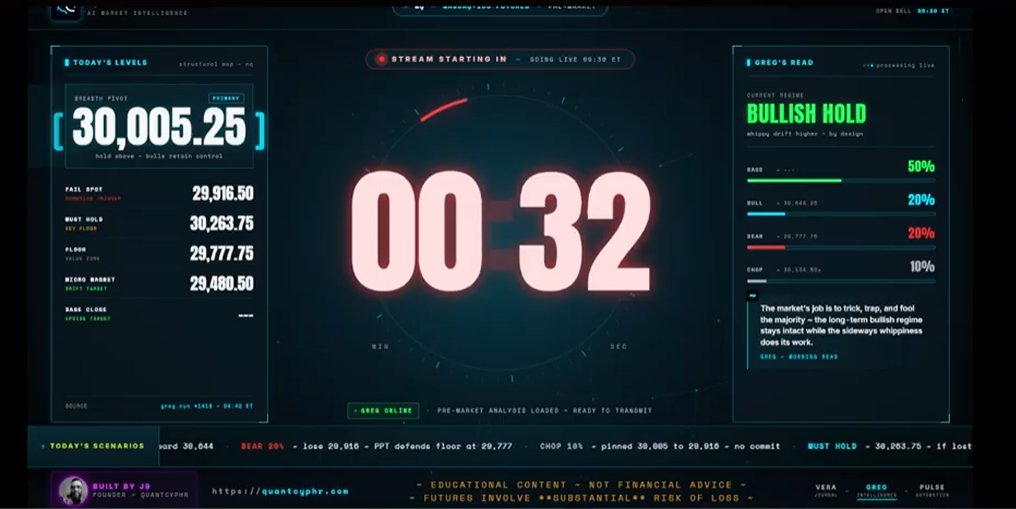
We mapped the day before the bell.
Greg’s morning read: BULLISH HOLD
Decision pivot: 30,005.25
Fail spot: 29,916.50
Must-hold: 30,263.75
Floor: 29,777.75
Now we’re live, the levels are in play, and QuantCyphr is already green on the day.
Stop watching the replay after the move.
Come watch the structure form in real time.
#QuantCyphr #NQ #FuturesTrading #DayTrading
Market Outlook: Market Neutralized ~ The Peril of Narrow Mega-Cap Leadership.
Today's image labels Monday's bounce a "neutralized, not bullish" tape and the market a "neutral scenario" of choppy consolidation. The S&P gained 1.2% and the NASDAQ gained 2%, but the database is explicit: those gains canceled previous pressure rather than confirming a trend. The structural read on the same page is the warning. Index strength is increasingly reliant on narrow mega-cap technology leadership, with underlying model deterioration in the key tech names that are supposed to be carrying the floor. The bounce was real. The breadth behind it is the question.
The sentiment side carries the cancellation read honestly. Monday's S&P +1.2% and NASDAQ +2% are headline-driven rather than the result of durable price discovery ~ the database calls the rally a neutralization of late-week downside momentum, not a new bid. June performance targets reinforce the read: the S&P is expected to close the month down 2% with the NASDAQ off about three and change. Even with Monday's bounce, the month is staged to end red. And the calendar is turning to a high-impact week: Consumer Confidence at 93.9 forecast and July 2 Labor Data with a 130K NFP print. Two prints will resolve the neutral.
The structural side is where the warning sits. Sector conviction stands at 83.33% long ~ a strong top-down reading on its own. But symbol-level participation sits at 55.82%, and the gap between them is the entire top-heavy breadth warning the image labels directly. Sectors are voting bullish; the individual names underneath are not following. The narrow leadership risk panel makes the mechanic concrete: index strength is concentrated in key technology names like MSFT, with the database flagging underlying model deterioration in those same names. Top-down looks healthy. Bottom-up does not. When a rally is being held up by the few names that are starting to crack, the rally is borrowing time it is not earning.
The critical price levels set the test on both sides. NQ triggers bullish on a close above 30,191.35 and bearish on a break below 29,798.65. ES triggers bullish on re-entry above 7,518.26 and bearish on a fail inside 7,468.74. The image also names a mid-term downside target on the S&P at 7,200 ~ the path that opens if the bearish triggers confirm. Each level is a daily-confirmed trigger, not an intraday touch, and the spacing between the upside and downside trigger on each instrument is the band the neutral scenario sits inside. Above the upside trigger, the rally earns the bid. Below the downside trigger, the mid-term target opens.
Trade the band. Respect the 83.33%-to-55.82% gap as the breadth tell. Watch July 2 payrolls and Consumer Confidence as the catalyst pair. The bounce was real. The breadth is thin. The triggers decide whether thin holds or thin cracks.
https://t.co/kxh5s9HmRq #Macro #SPX #Futures #Markets #QuantCyphr
I released one of the indicators we use live on stream.
QuantCyphr State, QC-S, is now free on TradingView.
No email.
No opt-in.
No funnel.
Just add it to your chart.
QC-S is built to make market state easier to read:
Are we in bull structure or bear structure?
Where did the regime flip?
Is the move still holding state?
Where are the recent flip levels?
Is price actually changing character, or are you just reacting to noise?
It is not the entire QuantCyphr system.
We still use Vera, Greg, scenario maps, levels, other indicators, and post-session review.
But QC-S is a big piece of why our live chart read feels cleaner.
The goal is simple:
less guessing
less candle-by-candle panic
more structure
Try it here:
https://t.co/abYK9xbRSs
If it helps your read, I’d appreciate a boost on TradingView. That helps more traders find it 🙏
#QuantCyphr #TradingView #TradingIndicator #MarketStructure #DayTrading
Market Outlook: ~ Sustainability vs. the Bubble Narrative.
The bubble call has become the consensus call. Today's image takes the other side, and it does it with numbers rather than narrative. Global AI sales hit $25 billion in Q1 2024 against $21 billion in estimated depreciation costs ~ a net sustainability margin of $4 billion. Revenue is surpassing depreciation. That single relationship is the entire bubble-vs-not test. If the spend is producing more revenue than it is destroying through asset decay, the spend is not a bubble. It is a build.
The hardware side stacks the same way. Four-year-old Nvidia H100 chips retain nearly 80% of their launch rental price ~ a depreciation curve that historical bubble assets do not show. The earnings side runs the second proof: unlike historical bubbles fueled by central bank debasement, AI growth is fueled by corporate earnings. That is a category difference, not a degree difference. A bubble inflated by money printing breaks when the printing stops. A spend cycle funded by profits breaks when the profits do.
The institutional bet sizes the conviction. Four major hyperscalers are projected to spend $5.3 trillion on capex by 2030. That is not a marketing number. That is a long-dated commitment from the entities with the deepest read on demand, the longest planning horizons, and the most to lose if the demand turns out not to be real. The build is being underwritten by the customers who would be the first to know if the build were unwarranted.
The extended-lifespan data closes the demand read. Amazon continues running 8-year-old servers because persistent high demand keeps them in production rather than retiring them on schedule. That is the inverse of a glut. A bubble produces excess capacity that depreciates faster than the use case absorbs it. This print shows the opposite ~ assets twice past their replacement window still earning. The use case is consuming hardware faster than the hardware is being retired.
The catch is the right frame for what comes next. A correction can still happen, and the image names the shape ~ a "non-popping" bubble where the market resolves through earnings growth catching up to the multiple rather than through a catastrophic price crash. That is the more interesting risk read. Not whether the spend pops. Whether the prices the market is paying for the spend get re-set without the spend itself collapsing. The build is real. The price the market pays for the build is the variable. Sustainability and overvaluation are not the same trade.
https://t.co/kxh5s9HUGY #Macro #Nvidia #Semiconductors #QuantCyphr
Market Outlook: Anchoring the Range ~ Intermediate Stability vs. Headline Noise.
Today's image reframes the recent pullback. A 3% drop in the S&P sits on the page next to the database's core thesis: no material regime change, intermediate structure unchanged, market still inside a sideways range. The volatility on top is labeled noise. The structure underneath is labeled anchor. That is the divide the post organizes around ~ the database calling its own recent prints temporary, with the next catalyst named and the pivot above the tape priced as a make-or-break test.
The noise read carries both sides honestly. Short-term fluctuations from geopolitical tensions are flagged as quickly reversing ~ the database labels them temporary noise with an explicit warning. The status quo Fed backdrop runs alongside it on the right of the page: contained oil prices and stable inflation reduce the case for aggressive rate hikes, which means the macro backdrop is not the driver of the 3% drop either. Geopolitical news is the cause. Monetary policy is the floor. The intermediate database is the anchor. Three threads point the same direction ~ the pullback is not a regime change.
The catalyst calendar makes the test concrete. July 2 is flagged as the high-impact employment day with Nonfarm Payrolls forecast at 130K against a 110K consensus and a 172K prior. Unemployment rate sits at 4.3% across forecast, consensus, and prior, and average hourly earnings hold at 0.3% across the same three columns. The unchanged rows are the read on their own ~ the database is naming labor stability as the primary catalyst, and the chart shows nothing in unemployment or wages forecast to break the stability picture. If the print holds against consensus, the anchor narrative gets its confirmation. If it does not, the test moves to the data thresholds.
Trade the range. Respect the noise as noise. Watch July 2 payrolls and 7473.65 as the two-track test. The anchor is the database's call. The pivot is what proves it.
https://t.co/kxh5s9HmRq #Macro #SPX #FOMC #Markets #QuantCyphr