QuantivFlow: Bridging the Gap Between Institutional Algorithms and Individual Traders
QuantivFlow was built to provide individual investors with the same professional-grade tools used by large hedge funds. Our proprietary algorithmic engine filters out market noise, analyzing multiple technical indicators like RSI, MACD, and ADX simultaneously to deliver clear, objective, and actionable signals.
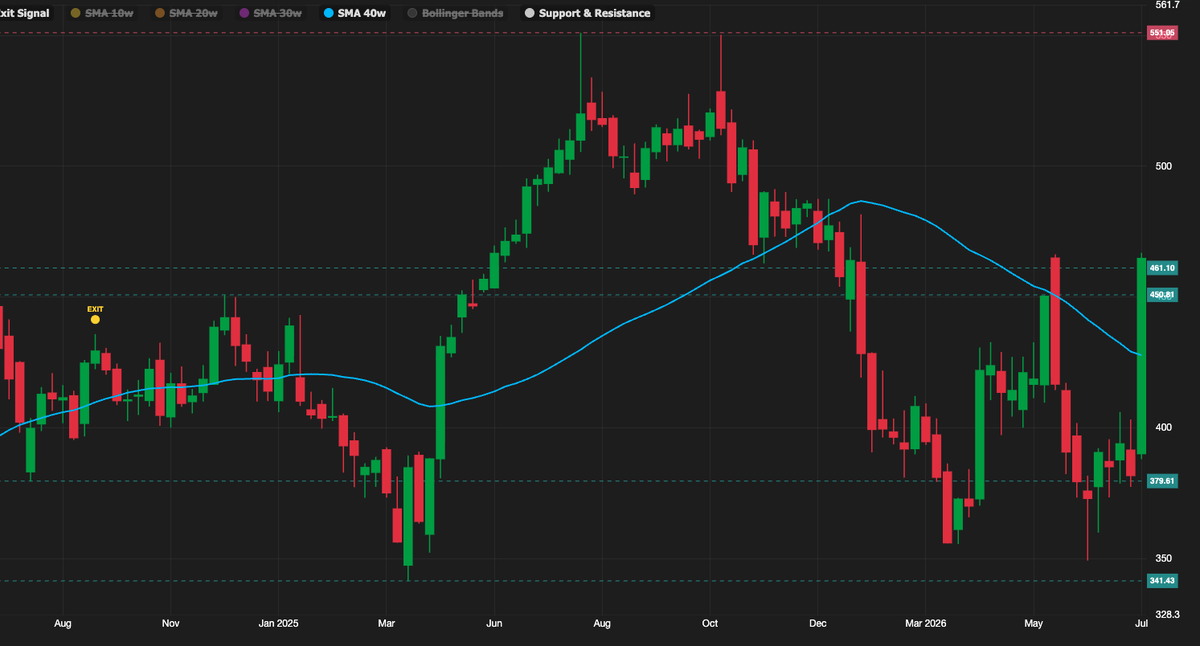
Microsoft just printed a MONSTER weekly candle!
Look at that last candle on the $MSFT weekly chart…
It’s a statement.
Price is now clearly on the path to a new all-time high.
Perfect W bottom formation
Smashed through the 40week moving average
Broke two major resistance levels in one move.
Volume nearly 2X the average weekly volume.
ADX screaming strong momentum.
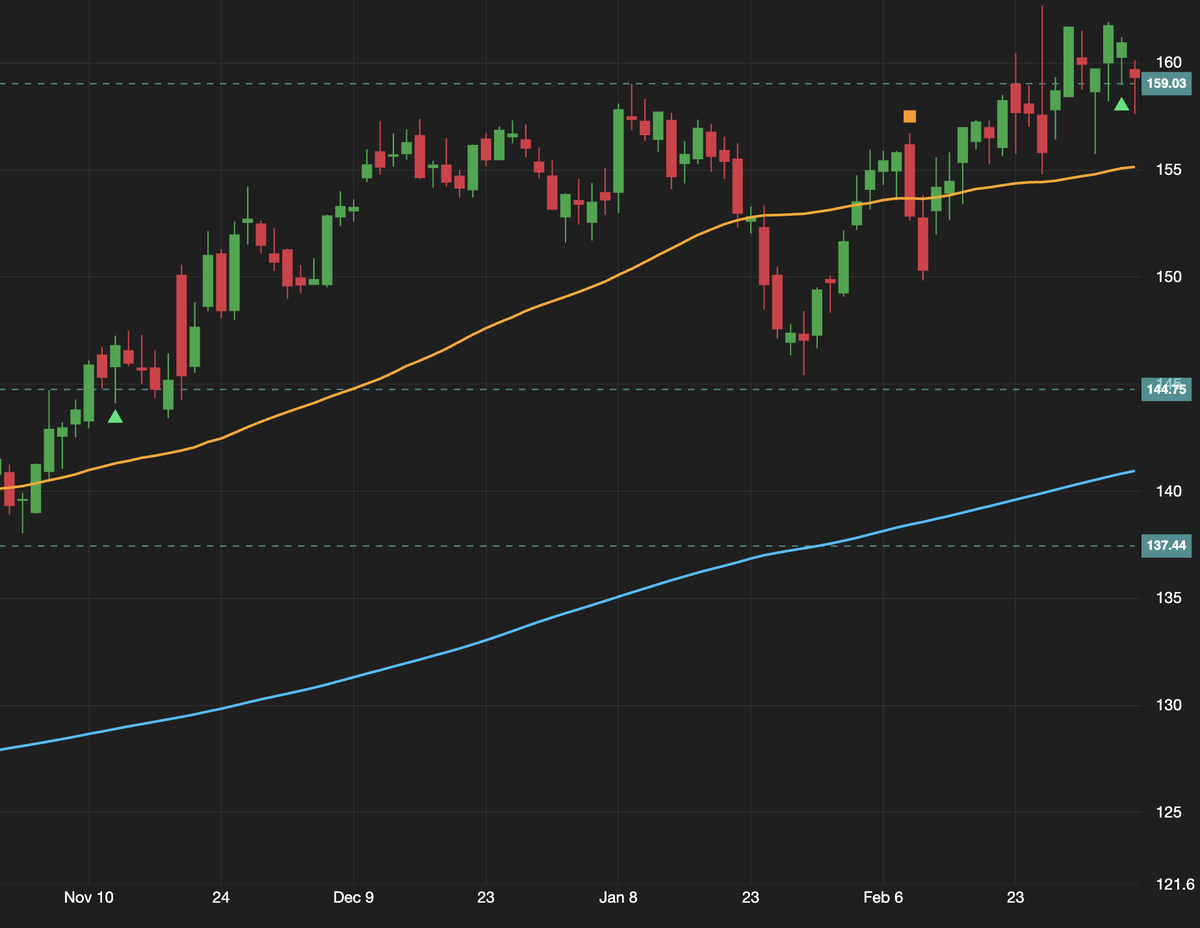
$TJX is holding the line! 💪
Despite geopolitical noise affecting the broader market, TJX continues to trade with strength around the $159 level.
The Setup:
Support: $155
Resistance: $161
Momentum: MACD is looking bullish.
The trend is your friend as long as we stay above the SMA 50. Watching for a push past recent highs to confirm the next breakout! 🚀
#TJX #ConsumerDiscretionary #Stocks #Alpha #Trading
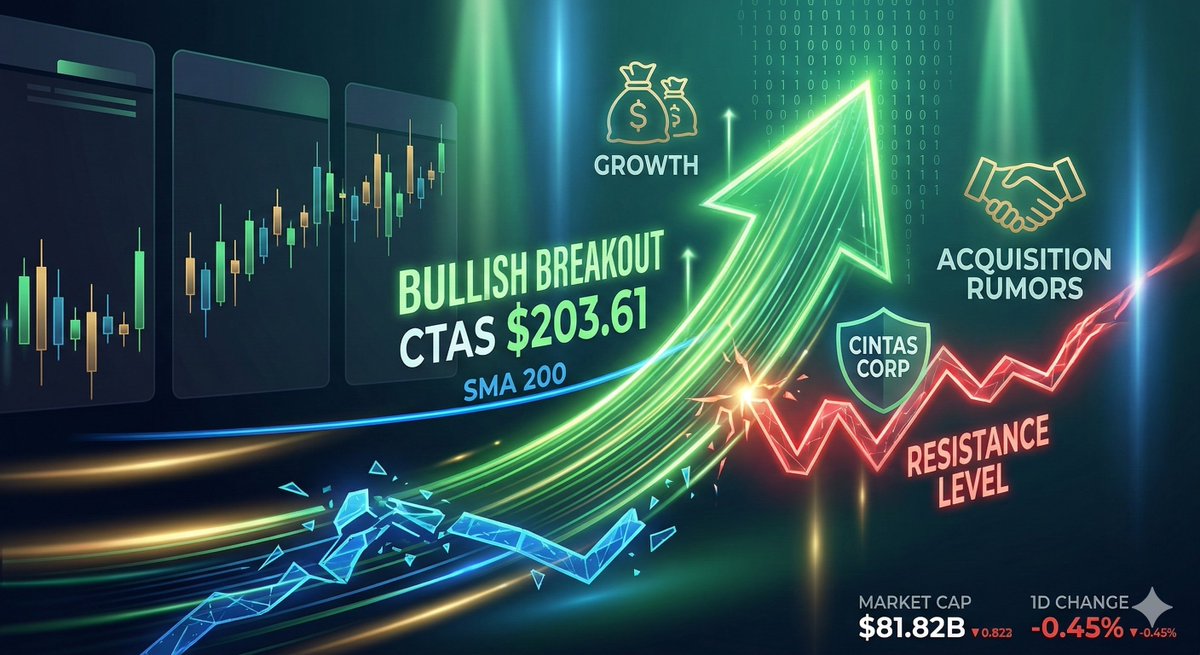
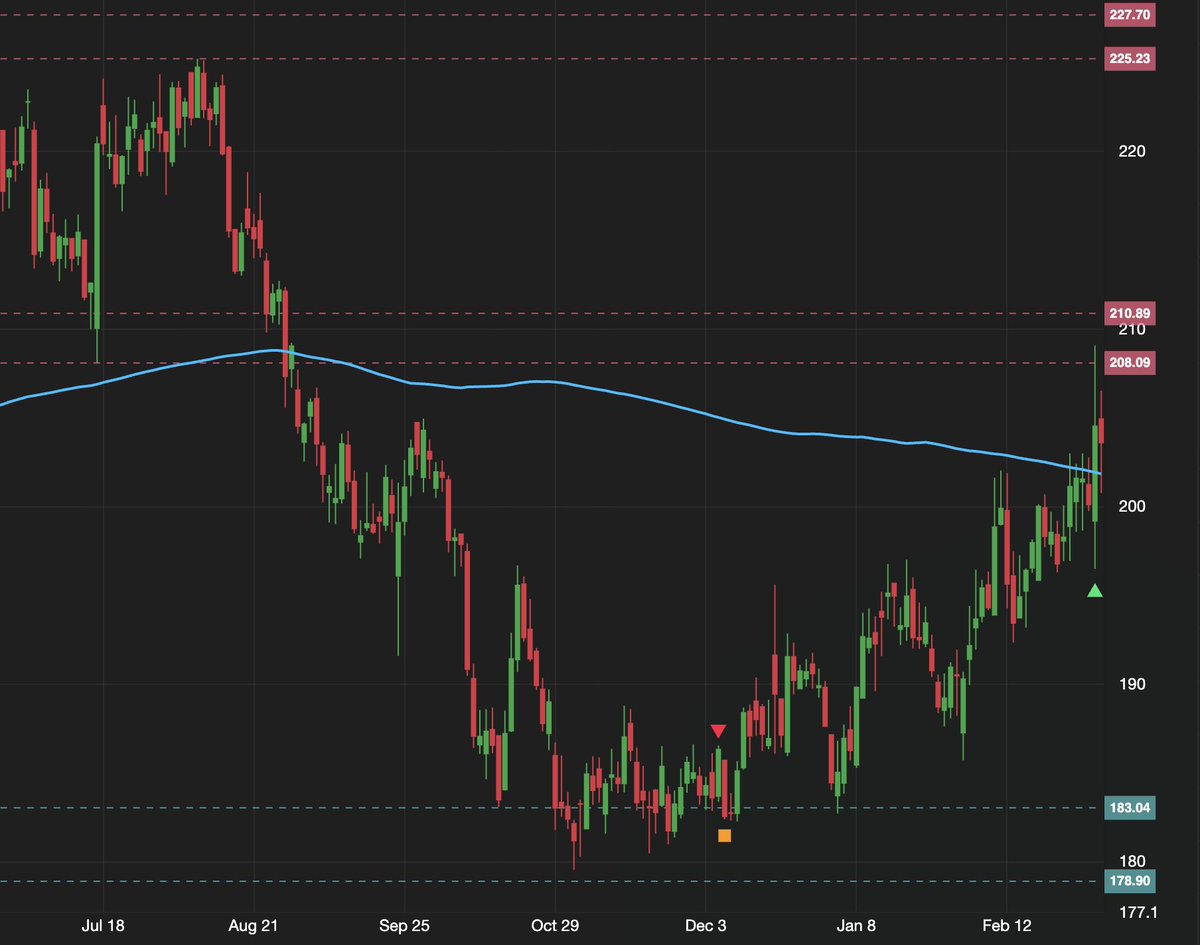
Bullish breakout for $CTAS! 🚀
After a long consolidation period below the 200-day moving average, Cintas has finally broken out to the upside, clearing the $200 level.
📈 Technical Analysis:
The Breakout: Price has established itself above the SMA 200, signaling a potential long-term trend reversal.
Support: The $200 level is now flipping from resistance to potential support.
Momentum: MACD shows positive momentum, and we’ve spotted a significant spike in trading volume over the last few days.
🔍 On the Radar: Rumors regarding a potential acquisition of UniFirst could provide further fuel for this move.
Target Price: $210 - $215
Stop Loss: Below $195
#CTAS #StockMarket #TechnicalAnalysis #Cintas #Investing
'The Volume is approving' + that massive climax at the lows screams seller exhaustion. Classic absorption setup – sellers capitulated hard, buyers stepping in with conviction.
🚨 Software Stocks at a make-or-break level! 🚨
Take a look at the $IGV WEEKLY chart. After a brutal pullback from the $117 highs, we just printed a textbook HAMMER candle 🔨 right at a major historical support zone (~$76) AND perfectly tagged the long-term moving average.
The bulls are finally stepping up. Have we hit the ultimate bottom? 🤔📈
#StockMarket #Trading $IGV #TechStocks #PriceAction #FinTwit
@cgtwts Spot on – Dario's words are the ultimate AI Shock!
From "AI helper" to full replacement in 6-12 months... and stocks like $CRWD already -8% from Anthropic's latest.
https://t.co/dyOuud6vpG
@zerohedge@zerohedge Exactly – AI incidents are skyrocketing because it's moving from "helper" to "replacement" overnight.
#CyberSecurity real stock drops like $CRWD -8% from Anthropic's latest.
https://t.co/dyOuud6vpG
@benkuk88 Spot on! AI is optimizing tasks, but for stocks like $CRWD, it's a full disruption.
Which companies do you see leading the workflow redesign? $MSFT or $GOOGL?
🚨 WALL STREET IS HOLDING ITS BREATH...
Anthropic’s next announcement drops in days.
Everyone is terrified.
No one knows which stock or sector gets CRUSHED first.
#AIShock#Anthropic#StockMarket#Trading#AI
Trade Close: Truist Financial Corp (TFC) – Technical Exit
I’ve officially exited my position in $TFC. While the macro trend has been great, the technical indicators are signaling a loss of momentum and a shift in sentiment. Here’s why I decided to step out:
The "Why" Behind the Exit
MACD Bearish Crossover: The MACD histogram has flipped negative (-0.289), confirming a bearish crossover. This suggests the upward trend has lost its "engine" for now.
Stochastic Breakdown: The Stochastic %K has plummeted to 20.752, signaling that the stock has moved from overbought into a sharp corrective phase.
RSI Neutralizing: The RSI has dropped to 50.901, moving away from bullish territory and suggesting that the buying pressure has completely equalized with selling pressure.
Low ADX Strength: The ADX is sitting at 18.889, which indicates a very weak trend. This tells me the stock is likely to enter a sideways or choppy period rather than a clean continuation.
Bottom Line
The price action rejected the recent highs, and the oscillators (MACD/Stochastic) are screaming "caution." Rather than sitting through a potentially deep retracement, I’m locking in profits and waiting for a better risk/reward entry.
Closed my trade on $CMI (Cummins Inc.) today! 🚛
Check out that ADX momentum. Riding the trend for 214 days led to a solid +72.90% return. Patience and technicals in perfect sync.
Entry: $341.40
Exit: $590.26
#Trading#Stocks#TechnicalAnalysis#CMI#Momentum
Just closed my $AAPL long for a -2.84% loss. Sometimes the best trade is the one you exit before it gets ugly.
The charts aren't lying: MACD bearish cross, RSI slipping below 50, and the momentum has completely evaporated. Apple looks "heavy" here—failing to hold those February highs is a major warning sign.
Waiting for a better setup, maybe a retest of the 200MA. Cash is a position too. ✋💰
#AAPL #Trading #Stocks #StockMarket #TechnicalAnalysis
100 Days. 52.90% Gain. $ALB 🔋
Patience is the hardest skill to master in trading, but it pays the best.
Entered $ALB at $109.99 back in November when the trend started shifting. Stayed disciplined through the noise and exited today at $168.18 as we hit resistance.
Profit: +52.90%
Strategy: Trend Following
Plan the trade, trade the plan.
#Trading #Stocks #ALB #Lithium #Investing #FOMO