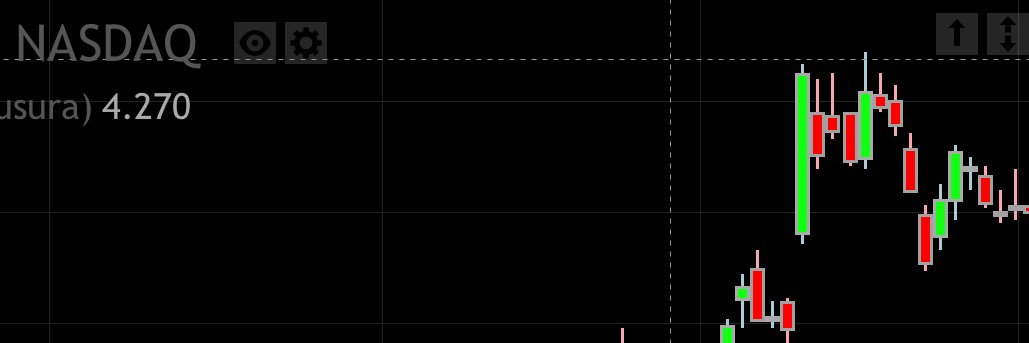
🚨 THE FINAL $OPEN BULL THESIS
THE GREAT $OPEN DISLOCATION
When price, ownership and fundamentals stop telling the same story.
I’ve rarely seen this many conflicting forces building inside one stock at the same time.
Forget the daily candles. Look at the math underneath $OPEN.
1/ INSTITUTIONS
Q1 institutional shares: ~455.6M
Q2: ~567.8M
+112.2M shares in ONE quarter.
+24.6% QoQ.
Ownership: 49.1% → 58.8%.
228 institutions increased positions vs 83 that reduced.
Largest additions:
BlackRock +54.3M
State Street +15.8M
Geode +12.6M
Morgan Stanley +12.4M
Sixth Street +10.3M
Top 5 alone: ~105.4M shares — ~94% of net Q2 institutional accumulation.
2/ SHORT INTEREST
Mar 31: 123.4M
Jun 30: 182.6M
Aug 31: 208.1M
+84.7M shares since March.
+68.7%.
Q2 institutional net accumulation alone equals ~54% of the ENTIRE current short position.
The top-5 institutional additions equal ~51%.
BlackRock’s increase alone equals ~26%.
That does NOT mean those shares are locked.
But it shows the scale of the two opposing forces.
3/ THE EXIT DOOR
Days-to-cover:
Mar 31: 3.63
Aug 31: 6.68
+84%.
At ~31.2M average daily volume:
25% short covering ≈52M shares ≈1.7 trading days of average volume.
50% ≈104M shares ≈3.3 days.
The short book got larger while the relative exit door got smaller.
4/ SUPPLY
Opendoor then retired 45.3M shares at $3.49, spending $158M.
That’s ~5% of shares outstanding.
45.3M shares = ~22% of current reported short interest.
Institutional Q2 accumulation + company retirement:
112.2M + 45.3M = 157.5M shares.
That is ~76% of current short interest IN SCALE.
Not “locked float.”
Not a squeeze guarantee.
But an enormous number relative to the short book.
5/ PRICE DISLOCATION
Russell 3000 inclusion day:
171.7M shares traded.
Close: $4.37.
Company buyback:
$3.49/share.
Using $2.56 as the reference price:
$3.49 = +36%
$4.37 = +71%
These are NOT price targets.
They simply show how far the equity has fallen below two recent, observable capital-flow reference points.
6/ THE BUSINESS
And this is not happening while operations are collapsing.
Q2:
Revenue +23% QoQ
Contribution Profit +59%
Contribution Margin +140 bps QoQ
Homes purchased +77% QoQ / +149% YoY
6,908 acquisition contracts on only $5M of marketing spend.
Operations expense per acquisition close:
$8.4K → $5.0K → $3.0K.
Homes listed >120 days:
Opendoor: 9%
Market: 27%.
Even after the August slowdown, management still guided to:
Revenue +10–15% YoY
Contribution Profit +70–75%
Contribution Margin 3.2–3.5%
7/ THE EQUATION
Institutional ownership ↑
Share count ↓
Short interest ↑
Days-to-cover ↑
Operating efficiency ↑
Price ↓↓
THAT is the divergence.
A falling stock is NOT automatically bullish.
But when price moves in the opposite direction from ownership, supply and operating variables, you get ASYMMETRY.
The next Q3 13Fs matter enormously.
If institutions materially sold, the thesis weakens.
But if ownership stayed near ~59% — or increased again — while 208M shares remain short and the company has reduced supply?
Then this setup becomes much harder to dismiss as “just another falling stock.”
That’s what I’m watching.
Not the candles.
The equation underneath them.
$OPEN @nejatian@rabois@ericjackson@mikealfred@MrAlwaysRugged@mudirshin@MrNeverSell@GMN_watch@urbnsteezus@chuckd1234567@theopendoorguy #ARMY
OPENDOOR Thought Exercise: 2P or not 2P... that is the question...😅
Everything you need to know about 2P and more...
🏘 - 1P was capital heavy.
🛤 - 2P is building the capital-light foundation.
💰 - 3P is where those rails can eventually open to outside capital and a much larger marketplace.
Execute the transition successfully...
Then we start talking Valhalla. ⚔️🪖
Here is how I see $OPEN 2P. 🧵
🚨 $OPEN — THE REBIRTH SETUP JUST TRIGGERED
This is what a textbook transition from seller exhaustion to an early reversal starts to look like.
For days, sellers kept attacking essentially the same floor:
$2.53 → $2.54 → $2.52
But something was changing underneath the price.
The downside was becoming less and less efficient.
Daily range compressed:
$0.175 → $0.150 → $0.110
Friday even printed a marginal new low at $2.52…
yet closed at exactly $2.56 again.
New low.
Zero additional downside on the close.
Then came today.
Open: $2.65
Low: $2.61
High: $2.73
Close: $2.68
For the first time in this entire decline we got the combination we were waiting for:
✅ Higher Low
✅ Higher High
✅ Highest close in 5 sessions
✅ $2.63 resistance reclaimed
✅ Intraday break above the $2.70–$2.705 lower-high zone
✅ Friday’s gap never filled
That last point matters.
Friday closed at $2.56.
Today’s LOW was $2.61.
The market had the entire session to send $OPEN back toward Friday’s price.
It never did.
And this happened immediately after the $2.50-heavy options expiration disappeared.
So the floor didn’t just survive OPEX.
Price moved away from it.
The internals are improving too.
BB %B:
0.016 → 0.040 → 0.070 → 0.117 → 0.235
$OPEN was virtually glued to the lower Bollinger Band.
It has now been progressively detaching from it for several sessions.
PVT tells another interesting story:
today’s move recovered essentially all of the volume-weighted deterioration of the previous sessions.
And after repeatedly being rejected below VWAP, today $OPEN closed almost exactly on it:
VWAP ≈ $2.679
Close = $2.68
That’s a real change in behavior.
The sequence now looks like:
downtrend → compression → failed downside expansion → seller exhaustion → upside expansion
That is the setup.
Is the reversal fully confirmed?
Not yet.
The next battlefield is obvious:
$2.70–$2.73
Today OPEN broke into that zone intraday but closed at $2.68.
If buyers can break and hold $2.70–$2.73, the $2.52 low starts looking much more like a genuine local bottom than another pause in the decline.
Volume is the one piece I’m still treating cautiously because the feed has been updating with a lag.
But price structure already gave us something we had not seen throughout this last leg down:
buyers finally produced a Higher Low, a Higher High and a Higher Close in the same session.
Friday looked like survival.
Today looked like the beginning of a reversal.
$OPEN
🚨 $OPEN — THE REBIRTH SETUP JUST TRIGGERED
This is what a textbook transition from seller exhaustion to an early reversal starts to look like.
For days, sellers kept attacking essentially the same floor:
$2.53 → $2.54 → $2.52
But something was changing underneath the price.
The downside was becoming less and less efficient.
Daily range compressed:
$0.175 → $0.150 → $0.110
Friday even printed a marginal new low at $2.52…
yet closed at exactly $2.56 again.
New low.
Zero additional downside on the close.
Then came today.
Open: $2.65
Low: $2.61
High: $2.73
Close: $2.68
For the first time in this entire decline we got the combination we were waiting for:
✅ Higher Low
✅ Higher High
✅ Highest close in 5 sessions
✅ $2.63 resistance reclaimed
✅ Intraday break above the $2.70–$2.705 lower-high zone
✅ Friday’s gap never filled
That last point matters.
Friday closed at $2.56.
Today’s LOW was $2.61.
The market had the entire session to send $OPEN back toward Friday’s price.
It never did.
And this happened immediately after the $2.50-heavy options expiration disappeared.
So the floor didn’t just survive OPEX.
Price moved away from it.
The internals are improving too.
BB %B:
0.016 → 0.040 → 0.070 → 0.117 → 0.235
$OPEN was virtually glued to the lower Bollinger Band.
It has now been progressively detaching from it for several sessions.
PVT tells another interesting story:
today’s move recovered essentially all of the volume-weighted deterioration of the previous sessions.
And after repeatedly being rejected below VWAP, today $OPEN closed almost exactly on it:
VWAP ≈ $2.679
Close = $2.68
That’s a real change in behavior.
The sequence now looks like:
downtrend → compression → failed downside expansion → seller exhaustion → upside expansion
That is the setup.
Is the reversal fully confirmed?
Not yet.
The next battlefield is obvious:
$2.70–$2.73
Today OPEN broke into that zone intraday but closed at $2.68.
If buyers can break and hold $2.70–$2.73, the $2.52 low starts looking much more like a genuine local bottom than another pause in the decline.
Volume is the one piece I’m still treating cautiously because the feed has been updating with a lag.
But price structure already gave us something we had not seen throughout this last leg down:
buyers finally produced a Higher Low, a Higher High and a Higher Close in the same session.
Friday looked like survival.
Today looked like the beginning of a reversal.
$OPEN
$OPEN hits $2.50 and I will buy 1M shares. Team seems locked in and making the right decisions, innovating on product, clearing inventory, working w/ecosystem. I know the #openarmy will @me if it happens. I am loading barrels - full cushion search this weekend, strap in.
🚨 $OPEN — PUTTING MY MONEY WHERE MY THESIS IS.
Fresh order just sent to my bank:
25,000 more shares at $2.50.
$62,500 waiting.
If $OPEN gives me $2.50, I’m not running.
I’m buying more.
Thesis posted.
Research posted.
Order placed.
Conviction means nothing until there’s money behind it.
Your move, market.
$OPEN
🚨 $OPEN — PUTTING MY MONEY WHERE MY THESIS IS.
Fresh order just sent to my bank:
25,000 more shares at $2.50.
$62,500 waiting.
If $OPEN gives me $2.50, I’m not running.
I’m buying more.
Thesis posted.
Research posted.
Order placed.
Conviction means nothing until there’s money behind it.
Your move, market.
$OPEN
This is the part of $OPEN that I think deserves more attention. 💙🏠
The opportunity may be much bigger than simply buying and reselling homes. If Opendoor can successfully connect mortgage, title, escrow and closing — even on homes it never owns — that could create a very different and more capital-light business model.
The early numbers are encouraging, but execution will tell the story. I’ll be watching the progress. 👀
One customer. Multiple opportunities. $OPEN
🚨 FINAL BULL THESIS — OPENDOOR: PART 2
THE HUGE MORTGAGE OPPORTUNITY THE MARKET MAY NOT BE PRICING YET.
Most investors still think about $OPEN like this:
buy house → resell house → collect spread.
But something much more interesting may be emerging underneath the core business.
Opendoor Home Loans is now OUT OF BETA.
And this is the key:
OHL can finance ANY home purchase in markets where it is licensed.
Not just Opendoor-owned homes.
That changes the size of the opportunity completely.
But before talking TAM, look at the early adoption.
COLORADO:
More than 50% of scheduled Opendoor resale closes were expected to be financed with Opendoor Home Loans.
TEXAS:
Nearly 1 in 5 — after ONLY SIX WEEKS.
These aren’t PowerPoint projections.
They’re REAL CUSTOMER BEHAVIOR.
Now look at just 3 strategically important markets:
TEXAS
356,285 purchase mortgages
Median loan: about $275K
Estimated purchase-mortgage TAM: about $98 BILLION
ARIZONA
95,029 purchase mortgages
Median loan: about $305K
Estimated TAM: about $29 BILLION
COLORADO
81,568 purchase mortgages
Median loan: about $355K
Estimated TAM: about $29 BILLION
COMBINED:
532,882 purchase mortgages.
About $156 BILLION in estimated annual purchase-mortgage volume.
And that’s ONLY TX + AZ + CO.
Nationally, Fannie Mae forecasts about $1.426 TRILLION of U.S. purchase-mortgage originations in 2026.
Now the fun part.
Just 0.5% of the estimated TX + AZ + CO opportunity:
about $780M in annual originations
about 2,660 loans
Just 1%:
about $1.56 BILLION in annual originations
about 5,330 loans
Not a forecast.
Just a way to understand the scale.
But here’s what I think investors may be missing:
THE TAM ISN’T EVEN THE REAL BULL CASE.
The real opportunity is the product chain.
SELL
→ Opendoor
BUY THE NEXT HOME
→ any property
FINANCE
→ Opendoor Home Loans
TITLE
→ Opendoor
ESCROW
→ Opendoor
CLOSING
→ Opendoor / Doma infrastructure
ONE CUSTOMER.
MULTIPLE MONETIZATION POINTS.
And we already know Opendoor can cross-sell transaction services.
Where its title product was available, Opendoor handled title on MORE THAN 80% of its home transactions in 2025.
Now mortgage is showing:
Colorado: 50%+ early attach
Texas: nearly 20% after six weeks
That’s what gets my attention.
Because it suggests Opendoor may be able to capture multiple economics from the SAME housing transaction.
Then add Doma.
The closing infrastructure now inside Opendoor has historically:
closed or insured 700,000+ properties
and issued more than $100 BILLION in title insurance.
Now connect the pieces:
MORTGAGE
+
TITLE
+
ESCROW
+
CLOSING
on a property Opendoor may NEVER need to own.
That changes the economics.
Opendoor says it expects substantially all originated mortgages to be sold into the secondary market, with gain-on-sale representing a significant part of mortgage revenue.
So the model becomes:
originate → close → sell loan → recycle capital
instead of:
buy house → deploy hundreds of thousands of dollars → hold inventory → resell.
This is NOT capital-free.
And we still need the KPIs that will prove the thesis:
funded loans
cost per funded loan
revenue per loan
gain-on-sale margin
attach rate outside OPEN inventory
But the question for investors may be changing.
OLD QUESTION:
“How many homes can Opendoor flip?”
NEW QUESTION:
“How much of the economics of a housing transaction can Opendoor capture WITHOUT EVER OWNING THE PROPERTY?”
Mortgage.
Title.
Escrow.
Closing.
If Colorado’s 50%+ attach proves repeatable…
if Texas keeps scaling…
and if OHL starts converting buyers of NON-Opendoor homes…
then Home Loans stops being a feature designed to help sell inventory.
It starts becoming a CAPITAL-LIGHT FINANCIAL LAYER underneath the entire Opendoor ecosystem.
And remember:
just 1% of the estimated TX + AZ + CO opportunity already represents about $1.56 BILLION in annual originations.
The market may still be pricing a house flipper.
$OPEN @nejatian
🚨 FINAL BULL THESIS — OPENDOOR: PART 2
THE HUGE MORTGAGE OPPORTUNITY THE MARKET MAY NOT BE PRICING YET.
Most investors still think about $OPEN like this:
buy house → resell house → collect spread.
But something much more interesting may be emerging underneath the core business.
Opendoor Home Loans is now OUT OF BETA.
And this is the key:
OHL can finance ANY home purchase in markets where it is licensed.
Not just Opendoor-owned homes.
That changes the size of the opportunity completely.
But before talking TAM, look at the early adoption.
COLORADO:
More than 50% of scheduled Opendoor resale closes were expected to be financed with Opendoor Home Loans.
TEXAS:
Nearly 1 in 5 — after ONLY SIX WEEKS.
These aren’t PowerPoint projections.
They’re REAL CUSTOMER BEHAVIOR.
Now look at just 3 strategically important markets:
TEXAS
356,285 purchase mortgages
Median loan: about $275K
Estimated purchase-mortgage TAM: about $98 BILLION
ARIZONA
95,029 purchase mortgages
Median loan: about $305K
Estimated TAM: about $29 BILLION
COLORADO
81,568 purchase mortgages
Median loan: about $355K
Estimated TAM: about $29 BILLION
COMBINED:
532,882 purchase mortgages.
About $156 BILLION in estimated annual purchase-mortgage volume.
And that’s ONLY TX + AZ + CO.
Nationally, Fannie Mae forecasts about $1.426 TRILLION of U.S. purchase-mortgage originations in 2026.
Now the fun part.
Just 0.5% of the estimated TX + AZ + CO opportunity:
about $780M in annual originations
about 2,660 loans
Just 1%:
about $1.56 BILLION in annual originations
about 5,330 loans
Not a forecast.
Just a way to understand the scale.
But here’s what I think investors may be missing:
THE TAM ISN’T EVEN THE REAL BULL CASE.
The real opportunity is the product chain.
SELL
→ Opendoor
BUY THE NEXT HOME
→ any property
FINANCE
→ Opendoor Home Loans
TITLE
→ Opendoor
ESCROW
→ Opendoor
CLOSING
→ Opendoor / Doma infrastructure
ONE CUSTOMER.
MULTIPLE MONETIZATION POINTS.
And we already know Opendoor can cross-sell transaction services.
Where its title product was available, Opendoor handled title on MORE THAN 80% of its home transactions in 2025.
Now mortgage is showing:
Colorado: 50%+ early attach
Texas: nearly 20% after six weeks
That’s what gets my attention.
Because it suggests Opendoor may be able to capture multiple economics from the SAME housing transaction.
Then add Doma.
The closing infrastructure now inside Opendoor has historically:
closed or insured 700,000+ properties
and issued more than $100 BILLION in title insurance.
Now connect the pieces:
MORTGAGE
+
TITLE
+
ESCROW
+
CLOSING
on a property Opendoor may NEVER need to own.
That changes the economics.
Opendoor says it expects substantially all originated mortgages to be sold into the secondary market, with gain-on-sale representing a significant part of mortgage revenue.
So the model becomes:
originate → close → sell loan → recycle capital
instead of:
buy house → deploy hundreds of thousands of dollars → hold inventory → resell.
This is NOT capital-free.
And we still need the KPIs that will prove the thesis:
funded loans
cost per funded loan
revenue per loan
gain-on-sale margin
attach rate outside OPEN inventory
But the question for investors may be changing.
OLD QUESTION:
“How many homes can Opendoor flip?”
NEW QUESTION:
“How much of the economics of a housing transaction can Opendoor capture WITHOUT EVER OWNING THE PROPERTY?”
Mortgage.
Title.
Escrow.
Closing.
If Colorado’s 50%+ attach proves repeatable…
if Texas keeps scaling…
and if OHL starts converting buyers of NON-Opendoor homes…
then Home Loans stops being a feature designed to help sell inventory.
It starts becoming a CAPITAL-LIGHT FINANCIAL LAYER underneath the entire Opendoor ecosystem.
And remember:
just 1% of the estimated TX + AZ + CO opportunity already represents about $1.56 BILLION in annual originations.
The market may still be pricing a house flipper.
$OPEN @nejatian
MOST $OPEN INVESTORS HAVE NO IDEA WHO KAZ @nejatian REALLY IS — AND IF YOU’RE SHORT, YOU SHOULD KNOW EXACTLY WHO YOU’RE BETTING AGAINST.
Everyone knows the label:
“Former Shopify COO.”
But that’s barely the beginning.
There is a pattern across his entire career:
payments → software → financial infrastructure → operational efficiency → scale.
And surprisingly, it starts when he was around 12 years old.
Kaz has told the story of working in his family’s stores in Canada, timing checkout lines and noticing card-processing costs were eating roughly 3% of the store’s profit.
His reaction?
Take the payment terminal apart and understand how it worked.
That childhood obsession would eventually become a career.
Kaz studied business and law, became a lawyer, then walked away from law to build.
He co-founded Kash, joined Y Combinator, and attacked payment friction through direct-bank-payment technology designed to reduce dependence on traditional card networks.
Then comes a detail almost nobody talks about:
Joseph Saunders — former Chairman & CEO of Visa — invested in Kash and became Chairman of its board.
Think about that:
a young founder trying to challenge traditional payment economics gets the former CEO of Visa to back him.
Kash was eventually acquired.
Founder → CEO → YC → fintech exit.
All before Facebook (Meta).
⸻
At Facebook (Meta), Kaz became Product Lead for Payments & Billing.
He worked on reducing barriers preventing businesses in cash-heavy markets from buying digital advertising without traditional credit cards.
And there is a technical footprint too:
Kaz is listed as a co-inventor on Facebook (Meta) IP involving electronic payments and payment-gateway routing.
The system describes using AI/ML techniques to predict gateway performance and dynamically route transactions.
Priority date:
May 24, 2019.
So before today’s AI boom:
payments + software + machine learning + financial infrastructure.
This wasn’t random job hopping.
It was compounding specialization.
⸻
Then Shopify.
Joined: 2019
By 2022: COO + VP Product
The organization he led covered:
Shop Pay
Shopify Capital
Shopify Balance
Shopify POS
major social-platform integrations
Look at the scale:
Shopify Capital: $2B+ funded to entrepreneurs by 2021, with Shopify analyzing 70M+ data points in its merchant assessment system.
Shop Pay: ~70% faster checkout and ~1.72× the conversion rate of a typical checkout.
By 2021, it had already been associated with nearly 500M orders.
Shop Pay Installments: in early access, Shopify reported 1 in 4 merchants saw 50% higher AOV, while merchants switching from third-party BNPL saw 28% fewer abandoned checkouts.
Shopify Balance: 100K+ U.S. small businesses opened accounts in its first four months.
But maybe the best example of Kaz’s operating style wasn’t a product.
It was Shopify itself.
In 2023, instead of creating another committee to discuss productivity, Shopify attacked meeting overload.
12,000+ recurring meetings removed.
Estimated time returned:
~322,000 HOURS/year.
And then they measured the output.
Shopify later reported:
−15% time in meetings
+37% engineering productivity
+56% projects completed per Product Manager
That’s the operating philosophy:
Find friction.
Delete it.
Redesign the system.
Measure the result.
Scale what works.
He doesn’t seem obsessed with managing processes.
He seems obsessed with redesigning them.
⸻
In 2025, Kaz was named to Gold House’s A100 Business & Technology cohort.
The same cohort included leaders from:
Google DeepMind, NVIDIA, Apple, Broadcom, Anthropic, OpenAI, Palantir and Snowflake.
And Kaz Nejatian.
Founder. YC. Fintech exit. Former Visa CEO backing. Facebook (Meta) Payments. AI-driven payments IP.
But whether you’re long or short:
KNOW WHO YOU’RE BETTING ON — AND KNOW WHO YOU’RE BETTING AGAINST
$OPEN @rabois@MrNeverSell@MrAlwaysRugged@open_army_japan@GMN_watch@ericjackson@mikealfred@chuckd1234567@mudirshin #army
MOST $OPEN INVESTORS HAVE NO IDEA WHO KAZ @nejatian REALLY IS — AND IF YOU’RE SHORT, YOU SHOULD KNOW EXACTLY WHO YOU’RE BETTING AGAINST.
Everyone knows the label:
“Former Shopify COO.”
But that’s barely the beginning.
There is a pattern across his entire career:
payments → software → financial infrastructure → operational efficiency → scale.
And surprisingly, it starts when he was around 12 years old.
Kaz has told the story of working in his family’s stores in Canada, timing checkout lines and noticing card-processing costs were eating roughly 3% of the store’s profit.
His reaction?
Take the payment terminal apart and understand how it worked.
That childhood obsession would eventually become a career.
Kaz studied business and law, became a lawyer, then walked away from law to build.
He co-founded Kash, joined Y Combinator, and attacked payment friction through direct-bank-payment technology designed to reduce dependence on traditional card networks.
Then comes a detail almost nobody talks about:
Joseph Saunders — former Chairman & CEO of Visa — invested in Kash and became Chairman of its board.
Think about that:
a young founder trying to challenge traditional payment economics gets the former CEO of Visa to back him.
Kash was eventually acquired.
Founder → CEO → YC → fintech exit.
All before Facebook (Meta).
⸻
At Facebook (Meta), Kaz became Product Lead for Payments & Billing.
He worked on reducing barriers preventing businesses in cash-heavy markets from buying digital advertising without traditional credit cards.
And there is a technical footprint too:
Kaz is listed as a co-inventor on Facebook (Meta) IP involving electronic payments and payment-gateway routing.
The system describes using AI/ML techniques to predict gateway performance and dynamically route transactions.
Priority date:
May 24, 2019.
So before today’s AI boom:
payments + software + machine learning + financial infrastructure.
This wasn’t random job hopping.
It was compounding specialization.
⸻
Then Shopify.
Joined: 2019
By 2022: COO + VP Product
The organization he led covered:
Shop Pay
Shopify Capital
Shopify Balance
Shopify POS
major social-platform integrations
Look at the scale:
Shopify Capital: $2B+ funded to entrepreneurs by 2021, with Shopify analyzing 70M+ data points in its merchant assessment system.
Shop Pay: ~70% faster checkout and ~1.72× the conversion rate of a typical checkout.
By 2021, it had already been associated with nearly 500M orders.
Shop Pay Installments: in early access, Shopify reported 1 in 4 merchants saw 50% higher AOV, while merchants switching from third-party BNPL saw 28% fewer abandoned checkouts.
Shopify Balance: 100K+ U.S. small businesses opened accounts in its first four months.
But maybe the best example of Kaz’s operating style wasn’t a product.
It was Shopify itself.
In 2023, instead of creating another committee to discuss productivity, Shopify attacked meeting overload.
12,000+ recurring meetings removed.
Estimated time returned:
~322,000 HOURS/year.
And then they measured the output.
Shopify later reported:
−15% time in meetings
+37% engineering productivity
+56% projects completed per Product Manager
That’s the operating philosophy:
Find friction.
Delete it.
Redesign the system.
Measure the result.
Scale what works.
He doesn’t seem obsessed with managing processes.
He seems obsessed with redesigning them.
⸻
In 2025, Kaz was named to Gold House’s A100 Business & Technology cohort.
The same cohort included leaders from:
Google DeepMind, NVIDIA, Apple, Broadcom, Anthropic, OpenAI, Palantir and Snowflake.
And Kaz Nejatian.
Founder. YC. Fintech exit. Former Visa CEO backing. Facebook (Meta) Payments. AI-driven payments IP.
But whether you’re long or short:
KNOW WHO YOU’RE BETTING ON — AND KNOW WHO YOU’RE BETTING AGAINST
$OPEN @rabois@MrNeverSell@MrAlwaysRugged@open_army_japan@GMN_watch@ericjackson@mikealfred@chuckd1234567@mudirshin #army
🚨 THE FINAL $OPEN BULL THESIS
THE GREAT $OPEN DISLOCATION
When price, ownership and fundamentals stop telling the same story.
I’ve rarely seen this many conflicting forces building inside one stock at the same time.
Forget the daily candles. Look at the math underneath $OPEN.
1/ INSTITUTIONS
Q1 institutional shares: ~455.6M
Q2: ~567.8M
+112.2M shares in ONE quarter.
+24.6% QoQ.
Ownership: 49.1% → 58.8%.
228 institutions increased positions vs 83 that reduced.
Largest additions:
BlackRock +54.3M
State Street +15.8M
Geode +12.6M
Morgan Stanley +12.4M
Sixth Street +10.3M
Top 5 alone: ~105.4M shares — ~94% of net Q2 institutional accumulation.
2/ SHORT INTEREST
Mar 31: 123.4M
Jun 30: 182.6M
Aug 31: 208.1M
+84.7M shares since March.
+68.7%.
Q2 institutional net accumulation alone equals ~54% of the ENTIRE current short position.
The top-5 institutional additions equal ~51%.
BlackRock’s increase alone equals ~26%.
That does NOT mean those shares are locked.
But it shows the scale of the two opposing forces.
3/ THE EXIT DOOR
Days-to-cover:
Mar 31: 3.63
Aug 31: 6.68
+84%.
At ~31.2M average daily volume:
25% short covering ≈52M shares ≈1.7 trading days of average volume.
50% ≈104M shares ≈3.3 days.
The short book got larger while the relative exit door got smaller.
4/ SUPPLY
Opendoor then retired 45.3M shares at $3.49, spending $158M.
That’s ~5% of shares outstanding.
45.3M shares = ~22% of current reported short interest.
Institutional Q2 accumulation + company retirement:
112.2M + 45.3M = 157.5M shares.
That is ~76% of current short interest IN SCALE.
Not “locked float.”
Not a squeeze guarantee.
But an enormous number relative to the short book.
5/ PRICE DISLOCATION
Russell 3000 inclusion day:
171.7M shares traded.
Close: $4.37.
Company buyback:
$3.49/share.
Using $2.56 as the reference price:
$3.49 = +36%
$4.37 = +71%
These are NOT price targets.
They simply show how far the equity has fallen below two recent, observable capital-flow reference points.
6/ THE BUSINESS
And this is not happening while operations are collapsing.
Q2:
Revenue +23% QoQ
Contribution Profit +59%
Contribution Margin +140 bps QoQ
Homes purchased +77% QoQ / +149% YoY
6,908 acquisition contracts on only $5M of marketing spend.
Operations expense per acquisition close:
$8.4K → $5.0K → $3.0K.
Homes listed >120 days:
Opendoor: 9%
Market: 27%.
Even after the August slowdown, management still guided to:
Revenue +10–15% YoY
Contribution Profit +70–75%
Contribution Margin 3.2–3.5%
7/ THE EQUATION
Institutional ownership ↑
Share count ↓
Short interest ↑
Days-to-cover ↑
Operating efficiency ↑
Price ↓↓
THAT is the divergence.
A falling stock is NOT automatically bullish.
But when price moves in the opposite direction from ownership, supply and operating variables, you get ASYMMETRY.
The next Q3 13Fs matter enormously.
If institutions materially sold, the thesis weakens.
But if ownership stayed near ~59% — or increased again — while 208M shares remain short and the company has reduced supply?
Then this setup becomes much harder to dismiss as “just another falling stock.”
That’s what I’m watching.
Not the candles.
The equation underneath them.
$OPEN @nejatian@rabois@ericjackson@mikealfred@MrAlwaysRugged@mudirshin@MrNeverSell@GMN_watch@urbnsteezus@chuckd1234567@theopendoorguy #ARMY
$OPEN is one of those stocks where the chart looks terrible, but the math underneath keeps getting more interesting.
Institutions added roughly 112M shares in Q2.
The company retired another 45.3M shares.
At the same time, short interest climbed to more than 208M shares and days-to-cover almost doubled from March.
So while the stock price kept falling, institutional ownership went up, share supply went down, shorts got bigger, and operating efficiency improved.
That doesn’t automatically mean squeeze.
It doesn’t mean institutions can’t sell either.
But it does create a very strange setup.
The bears are betting harder at the exact same time the available supply is getting tighter and the underlying business is showing better unit economics.
That’s why I’m not watching the daily candles anymore.
The next real test is Q3 institutional ownership and then the Q4 operating numbers.
If institutions are still holding around these levels and @nejatian can show ANI moving toward profitability, then the market may have to rethink what $OPEN is actually worth.
That’s the dislocation I’m watching.
Not price versus hope.
Price versus the numbers underneath it.
$OPEN — THE SELLER EXHAUSTION SETUP IS GETTING HARD TO IGNORE
I went back through OPEN’s own historical price action looking for similar setups.
But first, look at what has happened over the last 3 sessions:
LOWS
$2.530 → $2.545 → $2.520
DAILY RANGE
$0.175 → $0.150 → $0.110
That is roughly 37% range compression in only two sessions.
VOLUME
~41M → ~32M → ~30M
CLOSES
$2.59 → $2.56 → $2.56
This is the part I find fascinating:
Sellers have attacked essentially the same $2.50–2.53 area for three straight sessions.
Today they even managed to print another marginal low at $2.52…
and still produced ZERO additional downside on the closing price.
The lows are barely moving.
The range is collapsing.
Volume is contracting.
Yet the stock refuses to accelerate lower.
That is not proof of a bottom.
But it is exactly the kind of loss of selling efficiency you want to see near one.
And OPEN has shown remarkably similar behavior before.
OPEN-ONLY HISTORICAL ANALOGS:
APRIL 2026
Repeated lows around ~$4.30 after a sharp decline, followed by range/volume contraction.
From the setup:
+11.6% in 3 sessions
+22.5% in 5 sessions
+27.5% in 10 sessions
MAY 2026
Selling stalled around:
$4.17 → $4.15
The market stopped generating meaningful new downside.
What followed:
+10.5% in 5 sessions
+13.3% in 10 sessions
JUNE 2025
This may be the most interesting analog.
OPEN printed:
$0.5111 → $0.5084
A NEW marginal low.
But the breakdown failed.
From there:
+13.4% in 5 sessions
~+45% within 10 sessions
That later developed into the extraordinary July move.
I am NOT saying history has to repeat.
I’m saying that in OPEN’s own history, some of its strongest reversals started before the chart looked bullish.
They started when:
new lows stopped producing meaningful downside.
And that is exactly what I’m watching now.
Add the current context:
• RSI deeply oversold
• extreme weekly momentum readings
• ~$2.50 tested repeatedly
• volatility compressing
• volume contracting
• >208M shares reported short
• the massive $2.50-heavy Sept. options expiration is now gone
Which makes the next few sessions extremely interesting.
My confirmation map:
$2.50–2.52 holds → the floor survives
$2.63 breaks → first escape from compression
$2.70 breaks → the lower-high sequence starts failing
$3.00+ → the short positioning becomes a very different story
The bull case here isn’t:
“OPEN is down a lot, so it has to bounce.”
The bull case is:
the sellers keep hitting the same floor, with less volume, less range, and less result.
And OPEN’s own history shows that when this behavior finally flips…
the repricing can happen very fast.
$OPEN