$btc - htf data analysis
There is a 98.4% chance bitcoin does not go below 50k on a volatility adjusted basis.
In the light of our last post on #bitcoin's infamous electricity cost metric, where we called the bottom once again before a whopping 37% move all the way to 83k from the very bottom of 60k, called out live, all due to one of our most important signals passing by, I decided to go deeper into the analysis.
With all the random numbers thrown around, vague calls and loud celebrations of how the bears "called" this entire move proudly, and with that same conviction, expecting 50k and below, I think what people need the most right now, is at least one solid metric + data shared, describing how that happening, is a highly unlikely chance.
Good data and strong data in general is hard to dispute, but I still give the kind disclaimer that this is just my lens applied to that strong data. There are multiple ways to interpret data. With this one though, no matter the lens, interpretations are quite narrow and I think that's the very way to approach data analysis in trading.
I always find it quite funny when someone posts a chart of 3 data points, then concludes that the 4th one is a guarantee, whilst anyone who followed high-school statistics, knows otherwise, how 3 times 100% chance, doesn't mean 4th time, in a probabilistic world.
So with this post, I like to offer strong data, as well as explaining the logic behind the data (to remove the black box data-only effect), of why I am so confident we don't go below 50k.
Thank you in advance for this more extensive read. I am sure you will enjoy and some of you may feel some nostalgia every time I share a post like this given my historic reputation on these.
Without any time wasting further, let's get to it.
The logic
This one is about the miners electricity cost to produce 1 $btc. This is a vital metric. Now I know there is a lot of controverse around miners and their impact, but there is still an inflation of 0.84 per year on $btc to date since the last halving (about 164,000 BTC per year). Seems negligible but at the current price of Bitcoin (61k), that still equates to 10.7 billion dollars per year. So every year, 1/6th of the entire supply of @MicroStrategy 's entire holdings gets released into the hands of the miners, and with $btc's thin liquidity existing to this date, you wouldn't want to see that dumped on the market, certainly not every year. So yes, the miners still have a very important impact that can't be underestimated.
Put differently, that equates to @MicroStrategy's entire holdings being sold every 6 years (1.5 cycles long). If that doesn't put a different swing on the significance of Saylor's actual influence on the market, I don't know what will. And I believe I have convinced you now how impactful and in control the miners still are today. (In fact, I don't need to convince you, the production cost floor speaks for itself, still until today.)
So you don't want the miners to sell (which they mostly do, slowly, to keep their business running). But due to the current situation, they can't do that anymore, because the market has hit rare conditions, only happening a few times every cycle.
That is, the price has dropped below the average weighted electricity cost to produce one bitcoin:native per kWh.
Significant? Maybe. Let's put some logic behind it: Not only does that mean that the miners can't sell their $btc for a profit. It also means that it is simply cheaper to just log into a CEX (large funds: OTC) and buy 1 Bitcoin, instead of going through the pain of mining 1 Bitcoin. So not only does this make the miners (the people controlling $btc) not want to sell, it also makes them want to buy, because it is cheaper to just buy instead of mine them. And although I am not saying that is what they do, it is a large pressure and narrative on the market, which has driven price north without any deeper revisiting each and every time in history.
That is the logic behind why this works. Should we believe it blindly? Never. Successful trading and analysis is always a combination of data + logic and cross verifying two., never of just one or the other. But let's call it an assumption (assumption 1).
I could not write on one slate the amount of charts and videos and posts I see on X every day, only covering aspects of just one of the two, in mere lazy manner too, just throwing numbers around, or using complex risk metrics or equations without any logic behind it. It hurts the seeing eye.
All power to them however. Many are learning, many are adapting and many don't even trade, they just DCA and draw some charts telling everyone how they are "mostly right".
Short rant aside, logic by itself is strong and often missing, but we need data to verify logic (hypothesis) correctly.
Collecting data
How to do this? It's very simple. To compare how price compares against the continuous band of production/electricity cost, all it takes is simply mapping it out on a price-time chart on tradingview, which is the purple band represented below, starting with the production cost and the electricity cost as the floor. The production cost is higher due to mining equipment, and that cost also varies since mining rigs are tuned to performance, therefore cost, that is why a wide band appears. The electricity cost is the floor because that is disregarding capex into mining equipment, and electricity cost per kWh (worlds average) doesn't vary much over time.
What we also notice is how the elec/prod cost rises over time, due to two drivers:
➡️The halving (every halving, it becomes more difficult to mine 1 BTC, giving a large jump)
➡️ General competition (adoption driven, more miners = more competition for blocks).
Both feed the eternal adoption cycle of bitcoin and rising floor price (unless abandonment, the opposite of adoption happens, let's hope not, but there are clear signs it's not happening).
So, mapping out the elec/prod cost and simply comparing how far price bottom above or below each time it visited, gives us a statistical reference to where price will bottom now (or where it is unlikely to go now).
It is indeed a mere statistic, because volatility is somewhat statistically driven, intertwined with cycles.
One key note: volatility adjustment is important.
On that note, collecting how far the wick goes below the band each time in absolute sense, is not sensible enough. It is to its simplicity elegant, but price also needs to be adjusted for volatility because for example daily 40% up and down moves Today are far less likely than back when $btc was priced 1$ per coin. Anyone who ever traded microcaps or penny stocks, knows what I mean. So since we are using the entire population as back test data, we must adjust price for volatility.
How to do this? By price law books, the relation depends on liquidity (how thin it is), the operators controlling the markets and the time in the year, day, week. But in general terms, liquidity thickness is linearly proportional to volatility and volatility scales inversely with the fourth root of price.
What does the latter mean? If price doubles, it means volatility decreases with the fourth root of 2, which is 1.1892...
So when price wicks below the band in say 2015 for 20%, that means today, when adjusted for volatility, that difference should be 61k/whatever the price was in 2015. E.g. $61000/$250 = 244. Fourth root of 244: 3.95. Which means the 20% wick should be accounted for as a 5.06% wick in the data.
Keep in mind, this is a relatively rough assumption (assumption 2), but one backed by price-liquidity-volatility laws.
So throughout the entire history, we collect these data points of how far below or above the wick went relative to the electricity cost at that time, and compare that to the chances of reaching 50k now, by comparing how much further price has to go below the current low, which is 61.1k, conveniently aligning with the exact electricity cost of 1 $btc today.
Using 61.1k as the in-real-time of writing this post, that puts 50k: about -18% below that.
That sums up how to collect the data.
With assumptions again renamed below...
➡️ Assumption 1: the logic of miners' impact
➡️ Assumption 2: volatility decreases with the fourth root of price (market cap).
➡️ Assumption 3: normal distribution of random volatility differences around a given price point...
... we are ready to collect the data.
Data Analysis
Next, let's look at the data, let's look at the history, where I will be taking every single data point which has reached inside the production cost band as a high timeframe bottom data-point. Because frankly, as it speaks for itself, it has been a high timeframe bottom every single time.
Below, are all the data points, sorted by date (Monday starting the weekly candle), % wicked below (-) or above (+) the lower edge of the band, and its normalized %, normalized by the square root of volatility (assumption 2).
Date │ % wick (-) or (+) lower band │ Normalized %
➡️12 Jan 2015 │ -12.46% │ -2.83%
➡️17 Aug 2015 │ -26.41% │ -5.99%
➡️1 Aug 2016 │ +1.54% │ +0.45%
➡️9 Jan 2017 │ - 12.44% │ -4.30%
➡️20 Mar 2017 │ - 7.21% │ -2.56%
➡️10 April 2017 │ -11.26% │ -4.42%
➡️10 Dec 2018 │ -26.80% │ - 13.81%
➡️9 Mar 2020 │-26.45% │ -14.38%
➡️9 Sept 2020 │ - 9.22% │ -5.98%
➡️ 7 Nov 2022 │ -0.67% │ -0.47%
➡️10 Dec 2024 │ +8.47% │ +7.74%
➡️2 Feb 2026 │-5.45% │ -5.44%
Using the volatility-liquidity adjusted %'s into a mean and assuming they are normally distributed, which, in argument with a Poisson distribution, is acceptable. Both distributions lead to similar results, but a normal distribution is more lenient towards random events revolving around a centreline (here, the bottom line of the production cost band), hence my choice.
The mean is -4.33%. The sample standard deviation is 5.99%. However, we chose every single low so we opt for the population sdev, since we do indeed have a sample of the entire population. This sdev is 5.74%.
Within this population, the z-score of 17.16%, which is the excursion needed from the current low of 61.1k (which also aligns with the perfect bottom of the band), to reach 50k, is -2.14. This equates by law of statistics: to 1.6% chance of reaching 50k, a low chance.
What if we use the non-price adjusted volatility %'s?
Then the mean is −10.70% and the sdev is 11.69%. In this case, a -17.16% lower excursion from the current low of 61.1k, to 50k, has a z-score of -0.55. This aligns with 29%.
Conclusion
The chances of never reaching 50k or below are 71% when not adjusting for price-volatility and only 98.4% when adjusting for price-volatility. Let's be realistic, and choose the exact middle between both chances, which is 84.7%. Still a very high chance, more than enough to look for aggressive involvement.
So personally, regardless of whether my assumptions are correct (98.4% chance of no 50k), or are not (71% chance). I personally believe expecting lower than 50k is hopeful and wishful thinking to its peak. And this valley is just a mere opportunity for the bears to be loud and proud again, before absolutely missing the chance of lifetime opportune buying prices once again.
We take a look at the timeline, we take a look who is clearly and loudly bearish, who is loudly bullish, we mark them on the chart, and realize when extrapolated to the entire world, both are majority disfavouring proper data, in my humble view.
We look some months down the line, and see where we will be, and whether talking generally bullishly, or generally bearishly was the smartest move to flourish in the world of crypto finance.
$btc
Reaction achieved ✅
Yep, nice reaction expected as we closed shorts.
Retracements are longable now.
I won't be taking any, already had my nice share of recent trades in this bottom range.
I am writing a macro post next. With the bears dancing on the table and giving funny reactions to why my bottom call of 60k may be wrong, even before reaching 60k, I think it is about that time now.
All power to them, I could very well be wrong. But I don't think we are up for a lot more downside. And I'm going to share in detail why I believe so, and why I think the bears are wrong in my humble view.
$btc shorts
Closed the final 15% here.
As part of the plan to hold runners in case we get new lows, where I also expect a reaction back up.
Ideal place to TP, and fully close shorts.
Done, and dusted.
(Edited* chart towards m30 for cleaner view, X didn't let me edit the chart, so older version is deleted and replaced with exactly the same post except the chart)
Spot BTC ETFs snapped the longest-ever streak of outflows today, right at the 200 week SMA.
A sign of shifting sentiment from tradfi right at a key level.
Patience. The tide is turning.
$ETH
Mark Newton @MarkNewtonCMT noted today that Ethereum is now flashing Tom DeMark TD Sequential buy setup, which looks for a completed downtrend exhaustion pattern before a potential reversal higher - first time since Feb'26.
$BTC daily
Reacting precisely at the *ascending channel* target.
"Bear flag" targets lower than this are pure bearish hopium.
Anything can happen, but technically, the breakdown target has been met. Run it back turbo.
$BTC is reacting off the 200 week SMA and weekly megaphone after nailing the target for the breakdown of the ascending channel.
It is very early in the month. Lots of time to form a big lower wick before Q2 closes.
A rough summary of the key assumptions behind the bullish and bearish views on Ethereum (ETH)
1. The collapse of the PER model and the skeptical view
- The old blockchain token pricing logic was simple.
- More transactions → higher fees → token burn → higher value
- But Ethereum chose an L2-centric upgrade path to solve the problem of high fees.
- From an infrastructure perspective, the result has been a major success. Ethereum continues to maintain dominant market share in trust-critical areas such as RWA and stablecoins.
- But paradoxically, as mainnet fee revenue declined, a skeptical view emerged: “The Ethereum ecosystem may be growing, but the ETH token itself is failing to capture value.”
→ Up to this point, both ETH bulls and skeptics largely agree.
2. The bull case: a paradigm shift toward an “Economic Security Asset”
- ETH bulls argue that ETH should not be viewed as a cash-flow-based equity-like asset, but rather as an “Economic Security Asset” that underpins the stability of the system.
- Today, around 30% of ETH’s roughly $ 225bn market cap, about $ 70bn, is staked and used to validate the network.
- By contrast, the amount of RWA, excluding stablecoins, running on Ethereum and its L2s is currently around $ 20bn. In other words, the value of staked ETH is roughly 3.5x the value of RWA on the network.
- If, as institutions such as McKinsey and Standard Chartered forecast, the RWA market grows to $2–3tn by 2028–2030, roughly 100x from today, the key question is this:
- Can trillions of dollars of assets safely operate on top of the same level of staked security value, around $ 70bn, that exists today?
3. Staking value and the risk of a 51% attack
- Professor Oh Tae-min mentioned on 3pro TV that if the value of staked ETH is too low relative to the value of RWA assets, the risk of a 51% attack increases.
- Therefore, in his view, the ETH price must, to some extent, rise in proportion to the value of RWA.
- This is not entirely accurate. Most RWA products, such as tokenized Treasury MMFs, can be controlled off-chain by the issuer, including legally invalidating hacked transactions.
- Therefore, the practical possibility of stealing real assets simply by taking control of validators on a specific blockchain is limited.
- However, if even Ethereum, the largest and most decentralized public blockchain by market cap, were to face a serious security distortion issue, moving to another public blockchain with a lower security profile would not be a credible alternative.
- The alternative could be private blockchains operated by financial institutions themselves. But that would not align with the original purpose of issuing assets on public blockchains: expanding liquidity.
4. Financial institutions participating as validators through staking
- A more realistic scenario is that, in the future, large financial institutions leading RWA issuance themselves become validators and help secure the stability of the Ethereum blockchain.
- In other words, the argument is that RWA issuers will buy ETH in meaningful size and stake it.
- Tom Lee (@fundstrat) also recently said that Ethereum has entered a new phase: moving away from a stage led mainly by the Ethereum Foundation (EF) and toward a stage led by large-scale corporate validators.
- As a result, the ecosystem may be reshaped into a structure of “decentralized small-scale validators” plus “large financial institution nodes.” In this process, large-scale ETH staking lock-up could create a “supply cliff,” driving price appreciation.
Conclusion: the questions investors need to ask
1. Will the RWA market really grow 100x to around $ 3tn by 2028–2030?
2. Can Ethereum maintain its current dominant market share of 60–70% in that market? (vs financial institutions’ private chains)
3. Will financial institutions issuing RWA directly buy ETH and participate as validators?
4. To what extent, and at what slope, will ETH price appreciation from a supply cliff be proportional to the growth in RWA market cap?
Clarity Act + $HYPE ATHs will quickly change public opinion on crypto over the next several months
sentiment still very low, best time for finding asymmetric opportunities
onchain volumes & perps volumes up & to the right from here
$eth
After a daily top, now, a daily bottom
Quick post on $eth. My opinion on it is not often shared. I mainly track it as a close relative to $btc, as family members share dna and help understand each other, through usage of correlation mechanics (mmd, non-mmd, and relative cyclical timing).
But with the downtrend done imo and a bottom forming as openly spoken about on $btc, $eth quietly follows the way we know it so posting is relevant now.
So, the same way I posted my bottom plan on $btc, here is my plan on $eth, directly taken from $btc's inspiration as per usual, but with its own zones, plan and nuances in mind.
Good practice to do, because if both $btc and $eth have my exact reasons for a bottom, then it reinforces the plan of each in the way one extra confluence does.
A bottom
So indeed, just like $btc bottoms imo in its purple zone (situated 70-73k), imo, so does $eth bottom in its zone (situated 1900-2030). As a local refined zone, it is also supported by my modified version of the golden zone presented here.
"How do I draw your golden zone, Astro?" Pivots used are formed on 6th of Feb and 17th of April. With fibs active the 0.618 and the 0.67 "devil's fib" as my twist. At the same time, we have an H6 mmd with the Thursday low and Friday low as relatives, with the apex of the bottom the first tap of that mmd, right onto (slightly front run).
That front run, was verifiable with order flow with clear $eth signatures, which is why I love modern technology so much per my eternal frustration of being front run during the start of my career.
So truly, all you could ever wish for on $eth for a bottom, giving nice confluence to why $btc bottomed too.
2 assets, heavily correlated, leading to the same idea plus or minus nuances.
Locally, we have the same structure forming as well.
No trades taken here, not of interest, I prefer $btc, but the same techniques I use for $btc apply to $eth and can be used if preferred.
I know some of you like to trade $eth instead, so here you go.
I'd also like to remind you we still have the macro mmd of the Feb 6th low at play as the low is holding.
There are some more zones and confluences at play, but this is more than enough to keep you in the loop in case you want to trade $eth instead of $btc.
Happy we received our move down as a drop off 2450, now, confident in the bottom.
Enjoy.
$btc
My bearish daily bias is now shifting to bullish.
Now that we reached, per original estimate, 75k and local refined level using order flow: 74.1k, where we aimed to TP 99% (/all of our) shorts, caught in the trend which started for us with shorts from 83.4k, I now abandoned my bearish bias, and am back on the bullish bias.
You probably already know. I hinted and announced it many times already, but this is the official announcement.
Good to look for longs now, start longs, and no longer look for short exposure.
Enjoy, it has been a journey.
overall, i don't think BTC looks too bad
3 tap happening rn if can hold here
more support lower w/ daily block + trend line + bottom vwap
still overwhelming believe bottom is in + that we're just going through some time capitulation (ppl get bored and throw in the towel)
crypto will catch up to equities eventually imo, just gotta stick around until it happens + survive the volatility
$ETH market cap $256B.
The stablecoins running on it = $322B up 10x in 5 years, headed to $2T by 2030.
The tokenized real world assets settling on it are $65B, which are up 245x since 2020, headed to $10T by 2030.
The infrastructure is worth less than what runs on it.
Also the ETH/BTC ratio is at a 5 year low.
Either the thesis is wrong or the price is. I am betting on the latter.
Any strong opinions out there based on existing/projected data/facts?
$ETH
Some of my perspective on where the @ethereumfndn is going.
First of all, this is only my own view. The board is not just me, and I have no extra special powers on the board that the other board members do not. @aerugoettinea is the one executing much of this transition. My input has been largely on technical questions. The board is in the process of expanding, and my own power within the org will continue to decrease, which is honestly what I want.
The 2025 era brought many important improvements to EF and its ability to execute. Many issues were resolved, and EF continues to benefit from its improved efficiency and greater focus on concrete goals to this day. And so with those problems resolved, early this year, the largest remaining hole that I perceived was something different nagging at me: I would regularly spot people saying things like "vitalik says these beautiful things about ethereum needing to be decentralized, and have privacy, and be a sanctuary technology, but why do the EF's actions not reflect that?"
Now, you may have been hearing something different. You may not have been sensing a feeling of crisis at all, and maybe were hearing people saying that finally we were taking execution and BD seriously and the main task for us is to keep going that way and be even better and faster. Then probably there is genuine difference between you and me, in what kinds of criticism I take most seriously, and what kinds of critics through their criticism are most able to make me feel pain.
As an analogy, let's briefly switch over to a different domain.
One belief you can have about Google is that it is a success story, and has brought a lot of good to humanity in organizing the world's information. Another belief you can have about Google is that they had a beautiful idealistic beginning, but at some point the corruption of mainstream corporate attitudes seeped in, and they slowly bit by bit completely abandoned the "don't be evil" slogan.
My belief on Google specifically is probably somewhere between the two. BUT, if you had taken me back in time to ~2008, and offered me a button to press to make Google one or two standard deviations more "dogmatic", eg. give Richard Stallman permanent veto power over some key policies, I would immediately press it.
Why? Because a choice for one company is not a choice for the world, or even one country. Google existed and exists in the context of a technology industry generally drifting away from early idealistic don't-be-evil roots and toward greed for financial gain, totalizing visions of accelerated superintelligence, infiltration by sociopaths, and craven capitulation to (or worse, active participation in) government pressure for ideological control, surveillance and war. And so *one company* doing something different, positioning itself to be what George Bernard Shaw calls the Unreasonable Man, resisting the trend of the times, would have been better for freedom, balance of power and stability of society as a whole, than *all* large companies bending to dominant trends. This is a part of my version of pluralism.
This line of thinking is not just mine, but I also is not too far off from what Aya and others had in mind with the Mandate.
Now how does this all get to the role of the EF?
EF is not a "center of Ethereum", rather EF is "one node, with a defined purpose, alongside other nodes". We've always said that the EF should be the latter, but many in the Ethereum ecosystem (and even within the EF) wanted us to be the former. Now, we are taking action to ensure that we will be the latter.
This is particularly important because EF is a limited organization, with limited resources and limited organizational capacity. The EF has only ~0.16% of all ETH (less than many other individual ETH holders), whereas among other blockchains it's common for "the central foundation" to have 10-50%. Fiscally, the EF was originally designed to fulfill a limited work scope defined in the token sale docs and other pre-launch materials (building the chain software; getting through Frontier, Homestead, Metropolis, Serenity), which was fully completed in 2022; it was not designed to be an eternal steward.
And so today, the EF is choosing to use its remaining resources to pursue longevity over breadth (yes, this means we sell less ETH). The EF focuses *specifically* on those activities critical to the success of ethereum as a censorship/capture-resistant, open, private and secure system, that would not happen otherwise. This means making hard choices, and in some cases even activities that we highly approve of and people that we highly respect becoming outside of the EF. People of great technical talent, public respect and even alignment with the mission and CROPS being outside of the EF is in fact necessary if we want important tasks to be able to attract outside capital. This also means the EF taking opinionated stands culturally.
This is all intended in cooperation with all other parts of ethereum. We recognize that many other parts of the ethereum world highly respect CROPS and related values. But highly respecting is not the same as choosing to specialize and totally dedicate to a domain (Compare in a different domain: I think reducing animal cruelty is important, and I like vegan food, but am not full unconditional vegan myself)
EF is still in a transition period, and we expect its new long-term form to stabilize over the next few months. What are the guiding principles of this new form? Again, I am only one person, but I can give my answer from a technical perspective (there are also critical non-technical aspects).
At the core, *Ethereum must be impressive*. We are living in an age of highly intelligent AI and all kinds of other technological acceleration. "Status quo EVM, with a hard fork or two a year to optimize for short-term needs of users" is not interesting.
To some, "impressive" means: 250ms latency and 1M TPS. I think Ethereum trying to go that route is a mistake. Being as fast and as scalable as possible, and only a small epsilon more decentralized than the others, is a route to mediocrity, and if we try it we will lose.
I think Ethereum should scale. But I think Ethereum should strive the hardest to be deeply impressive in a different dimension: the CROPS dimension. This means things like:
* Provably bug-free Ethereum. This is a goal that all cybersecurity researchers would have thought is absurd and impossible, up until roughly 6 months ago. Now, it's on the cusp of being possible, thanks to AI-assisted formal verification. So we should be frontrunners in doing this.
* Available chain consensus. Ethereum is, and with lean consensus will cotninue to be, the ONLY chain that has both (i) traditional-BFT style properties that it's safe under asynchrony up to a high level of fault tolerance, and (ii) the bitcoin PoW-style property that under synchrony it's safe up to 49% attackers. As far as I can tell, literally no other chain has this or is planning for it; bitcoin goes for (ii) only and most other chains go for (i) only. Some will remember I fought hard for this, Unreasonably insisting that it is not OK for ethereum to rely on social consensus and hard forks to rescue ethereum from 34% of nodes going offline. It's OK for chains like hyperledger, bnb, solana, tempo, etc. It's not OK for bitcoin or ethereum or eg. zcash.
* Intermediary minimization. The fact that smart contract wallets, protocols like railgun, etc have to send transactions through intermediaries to get included onchain is honestly embarrassing, and it's a constant point of fragility. Hence the work on FOCIL and EIP-8141 (and 7701 and years of work before) to make transaction sending intermediary-minimized with public mempool and strong inclusion properties, in a truly general-purpose way, that covers not just eg. secp256r1, but also privacy protocols and much more. Kohaku is pushing intermediary minimization at the user layer, pulling Ethereum away from the dystopian status quo world where our wallets don't even verify the chain, send our private data out to a dozen third-party servers, and toward a brighter CROPS future.
Some of these goals are Unreasonable - maybe Ethereum would be "fine" getting only 50% of the way - what if we depend on intermediaries, but make it easy to switch? But going 50% of the way would not make Ethereum Deeply Impressive in the CROPS way. So we push for 100%.
Fortunately all these goals are compatible with high TPS, this is a major focus of research (esp. on scaling the state). Well-designed L2s can also help, especially L2s optimized for specific applications (eg. high-volume trading, privacy...). These goals are even compatible with significantly lower slot times, thanks to Raul's work on erasure-coded P2P, and many other optimizations.
The most high-value "product" of the ethereum blockchain, financially speaking, is ETH the asset. Ethereum secures $250 billion of ETH. The types of properties of Ethereum that I mentioned above are very good for ETH the asset. Nearly 90% of my net worth is in ETH, and most of the remainder is ~$40m of onchain fiat of which every dollar has already been allocated for some open-source biotech or software or hardware initiative. That said, there are aspects of supporting ETH the asset - *necessary* aspects even - that are outside the scope of the EF. This is where we need other heroes (some of whom hold more ETH than the EF does) to step in and help. EF has been recently thinking more about how it will relate to other such organizations, and give them needed initial support.
EF will be a smaller ship than in previous years, a more opinionated one - in some cases more opinionated in ways that might be difficult to comprehend - but a longer-lasting one, and one suited to making sure that ethereum brings something meaningful to the world. We are grateful to all those inside and outside the EF who are helping to make this happen.
NEW: @roundhill files for yet another AI related ETF with concentrated holdings. This time its the Roundhill Photonics & Optics ETF -- Ticker will be $LYTE
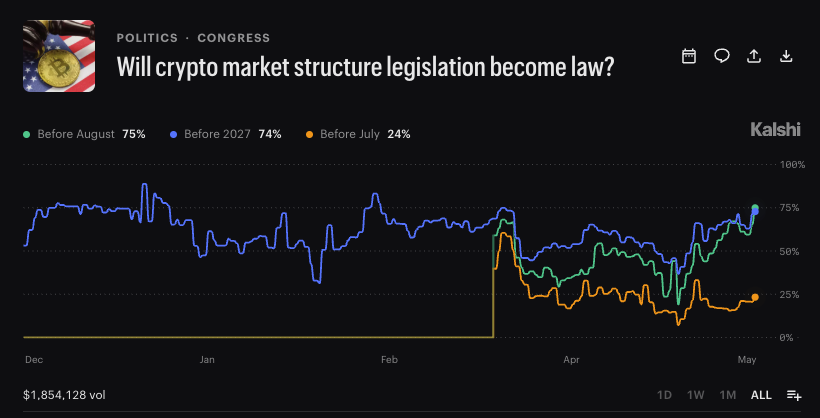
Kalshi traders putting likelihood of the CLARITY Act being signed into law at ~75%.
This follows the Senate Banking Committee's 15-9 vote (including support of 2 Democrats) in support of the bill, advancing it to the full Senate.