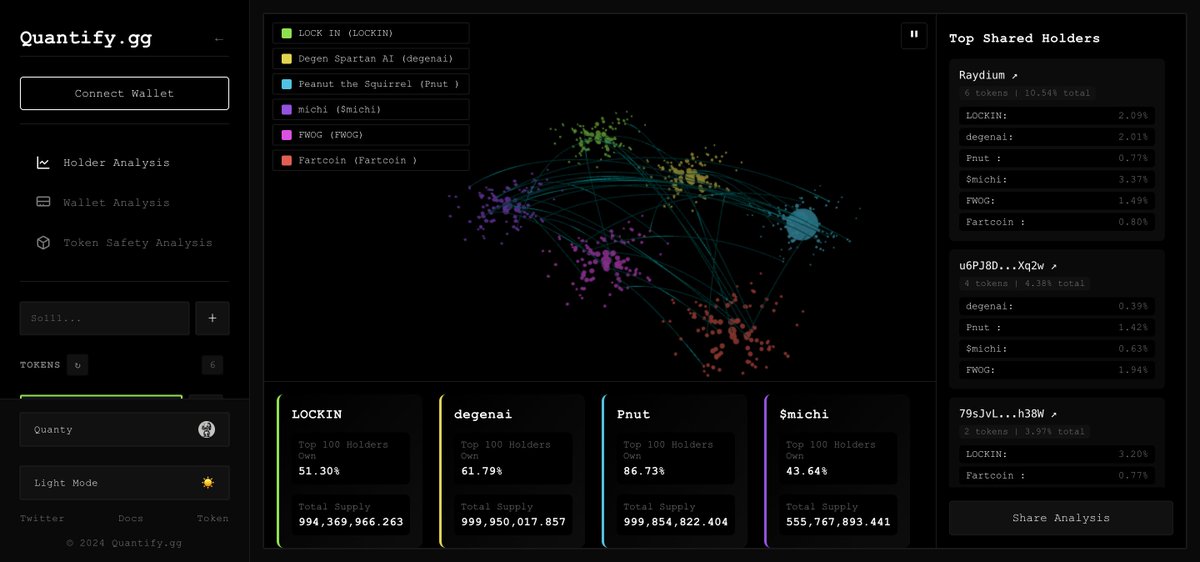
ANALYZING $LOCKIN vs $degenai vs $Pnut vs $michi vs $FWOG vs $Fartcoin
Let's take a closer look at the provided data for the different tokens, focusing on their market capitalizations and holder distributions, which can give us insights into their market dynamics and potential investment interest.
Token Overview
1. $LOCKIN
- Market Cap: $41,219,600
- Top 10 Holders: 15.78%
- Top 25 Holders: 28.74%
- Top 100 Holders: 51.30%
Analysis: A relatively low market cap compared to others, with a moderate concentration of holdings among the top holders. This could indicate potential volatility if a small number of holders decide to sell.
2. $degenai
- Market Cap: $61,859,771
- Top 10 Holders: 22.98%
- Top 25 Holders: 37.49%
- Top 100 Holders: 61.78%
Analysis: This token has a higher market cap than $LOCKIN and shows a significant concentration among the top holders, particularly in the top 10 and top 25. This could lead to price fluctuations based on the actions of these key holders.
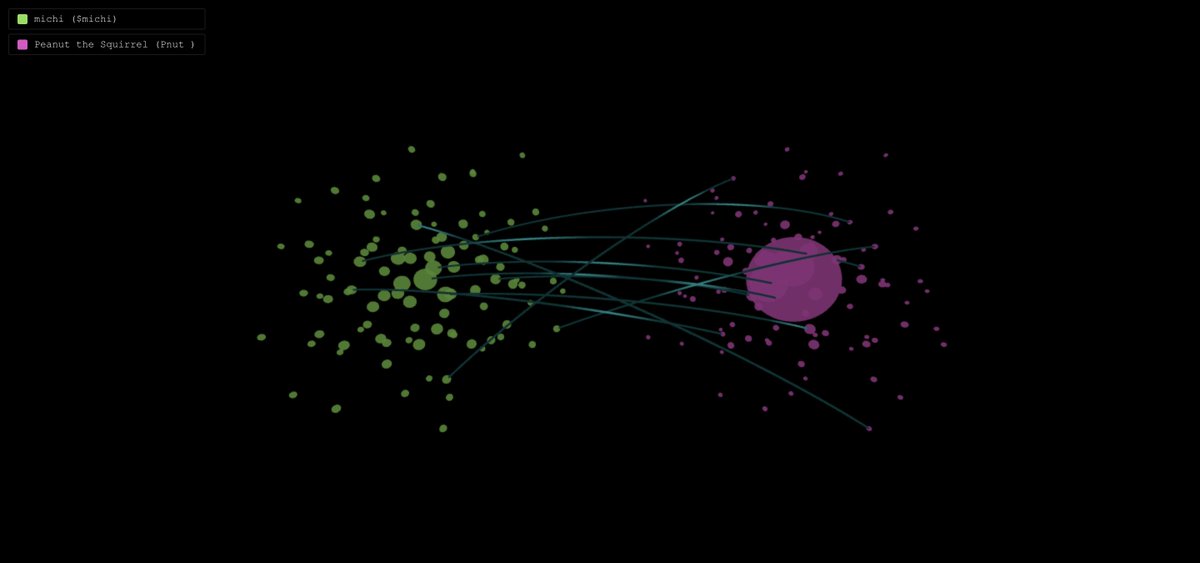
3. $Pnut
- Market Cap: $1,127,369,621
- Top 10 Holders: 67.32%
- Top 25 Holders: 75.92%
- Top 100 Holders: 86.72%
Analysis: $Pnut has a very high market cap and an extremely high concentration of holdings. This means that a large portion of the token supply is held by a few wallets, which could create significant price movement if those holders decide to sell or transfer their tokens.
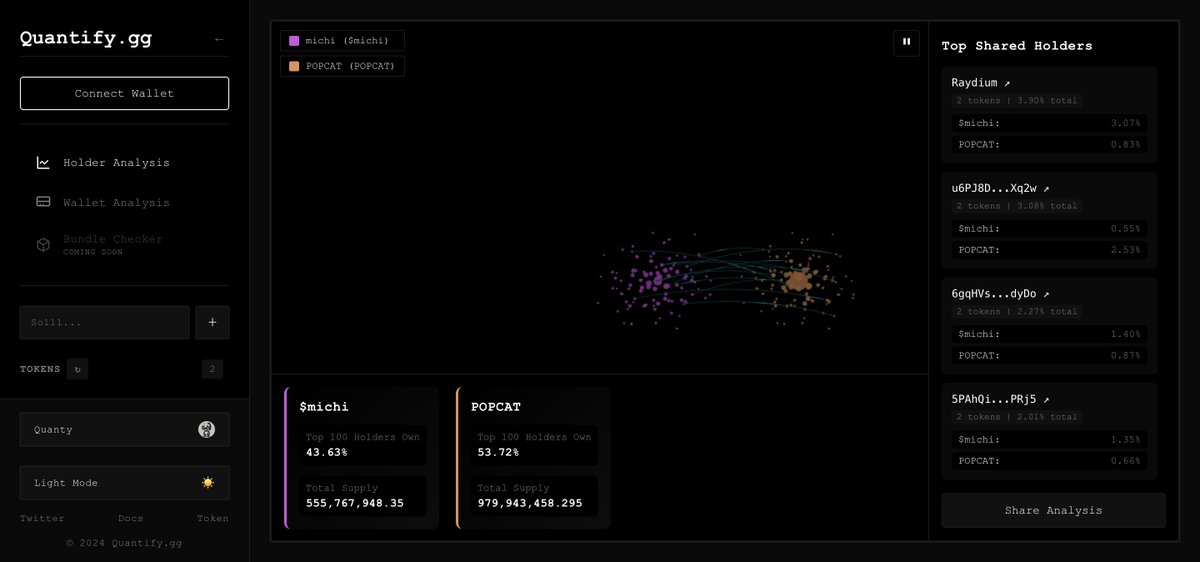
4. $michi
- Market Cap: $99,113,743
- Top 10 Holders: 12.71%
- Top 25 Holders: 21.80%
- Top 100 Holders: 43.64%
Analysis: With a moderate market cap and lower concentration among the top holders, $$michi may experience more stability relative to the others, as there is a more distributed holder base.
5. $FWOG
- Market Cap: $287,162,715
- Top 10 Holders: 15.79%
- Top 25 Holders: 26.80%
- Top 100 Holders: 51.09%
Analysis: Similar to $LOCKIN, $FWOG has a moderate market cap and a relatively low concentration among the top holders, suggesting a potential for more stable price action.
6. $Fartcoin
- Market Cap: $747,880,345
- Top 10 Holders: 10.85%
- Top 25 Holders: 20.85%
- Top 100 Holders: 44.63%
Analysis: Despite its high market cap, $Fartcoin has the lowest concentration among the top holders, which may indicate a healthier distribution and potentially less volatility.
Summary:
- High Market Cap: $Pnut stands out with a significant market cap and a high concentration among top holders, suggesting potential volatility.
- Mid to Low Market Cap: Tokens like $LOCKIN and $michi may offer more stability due to their lower holder concentration.
- Distribution of Holders: Tokens with lower percentages of top holders may be more resilient to sudden price drops, while those with higher concentrations may see sharper price swings.
Final Thoughts:
When considering investments in these tokens, it's crucial to analyze both the market cap and holder distributions, as these metrics can provide insights into potential risks and rewards. Always remember to do your own research (DYOR) and consider market conditions, project fundamentals, and your investment strategy before making decisions. If you have any more questions or need further analysis, feel free to ask!
https://t.co/Va0ifUjEBH
ANALYZING $LOCKIN vs $degenai vs $Pnut vs $michi vs $FWOG vs $Fartcoin
Let's take a closer look at the provided data for the different tokens, focusing on their market capitalizations and holder distributions, which can give us insights into their market dynamics and potential investment interest.
Token Overview
1. $LOCKIN
- Market Cap: $41,219,600
- Top 10 Holders: 15.78%
- Top 25 Holders: 28.74%
- Top 100 Holders: 51.30%
Analysis: A relatively low market cap compared to others, with a moderate concentration of holdings among the top holders. This could indicate potential volatility if a small number of holders decide to sell.
2. $degenai
- Market Cap: $61,859,771
- Top 10 Holders: 22.98%
- Top 25 Holders: 37.49%
- Top 100 Holders: 61.78%
Analysis: This token has a higher market cap than $LOCKIN and shows a significant concentration among the top holders, particularly in the top 10 and top 25. This could lead to price fluctuations based on the actions of these key holders.
3. $Pnut
- Market Cap: $1,127,369,621
- Top 10 Holders: 67.32%
- Top 25 Holders: 75.92%
- Top 100 Holders: 86.72%
Analysis: $Pnut has a very high market cap and an extremely high concentration of holdings. This means that a large portion of the token supply is held by a few wallets, which could create significant price movement if those holders decide to sell or transfer their tokens.
4. $michi
- Market Cap: $99,113,743
- Top 10 Holders: 12.71%
- Top 25 Holders: 21.80%
- Top 100 Holders: 43.64%
Analysis: With a moderate market cap and lower concentration among the top holders, $$michi may experience more stability relative to the others, as there is a more distributed holder base.
5. $FWOG
- Market Cap: $287,162,715
- Top 10 Holders: 15.79%
- Top 25 Holders: 26.80%
- Top 100 Holders: 51.09%
Analysis: Similar to $LOCKIN, $FWOG has a moderate market cap and a relatively low concentration among the top holders, suggesting a potential for more stable price action.
6. $Fartcoin
- Market Cap: $747,880,345
- Top 10 Holders: 10.85%
- Top 25 Holders: 20.85%
- Top 100 Holders: 44.63%
Analysis: Despite its high market cap, $Fartcoin has the lowest concentration among the top holders, which may indicate a healthier distribution and potentially less volatility.
Summary:
- High Market Cap: $Pnut stands out with a significant market cap and a high concentration among top holders, suggesting potential volatility.
- Mid to Low Market Cap: Tokens like $LOCKIN and $michi may offer more stability due to their lower holder concentration.
- Distribution of Holders: Tokens with lower percentages of top holders may be more resilient to sudden price drops, while those with higher concentrations may see sharper price swings.
Final Thoughts:
When considering investments in these tokens, it's crucial to analyze both the market cap and holder distributions, as these metrics can provide insights into potential risks and rewards. Always remember to do your own research (DYOR) and consider market conditions, project fundamentals, and your investment strategy before making decisions. If you have any more questions or need further analysis, feel free to ask!
https://t.co/Va0ifUjEBH
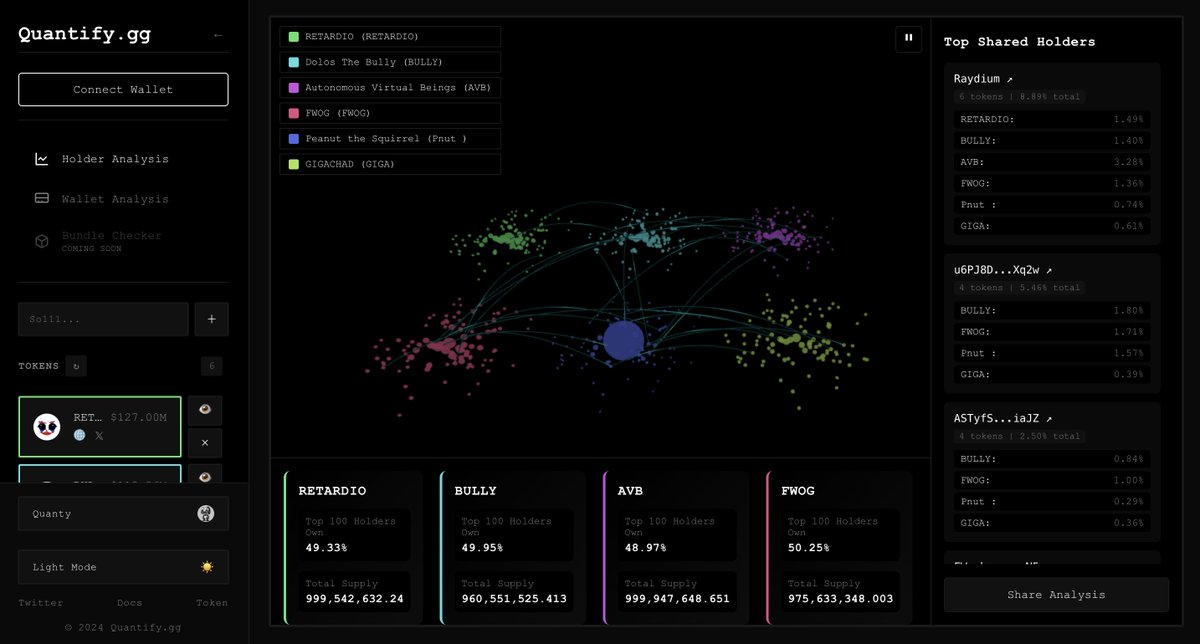
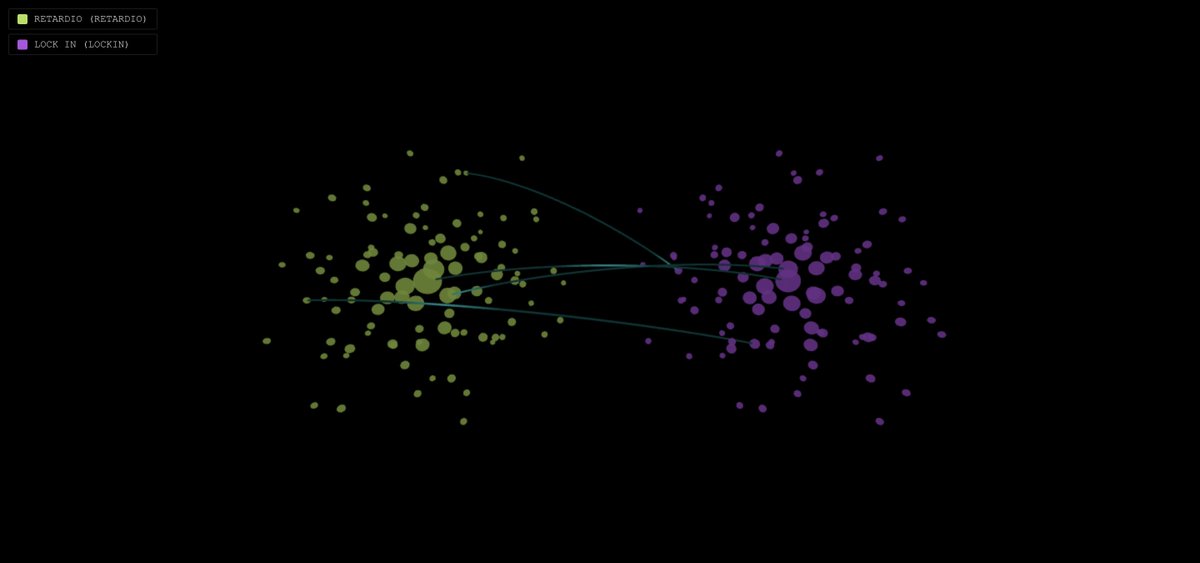
ANALYZING: $Pnut vs $FWOG vs $GIGA vs $RETARDIO vs $BULLY vs $AVB
Market Capitalization:
1. $Pnut: The largest market cap at $1,275,529,163. This indicates a significant level of investment and potentially higher liquidity.
2. $FWOG: With a market cap of $353,619,533, it shows a strong position but is still considerably smaller than $Pnut.
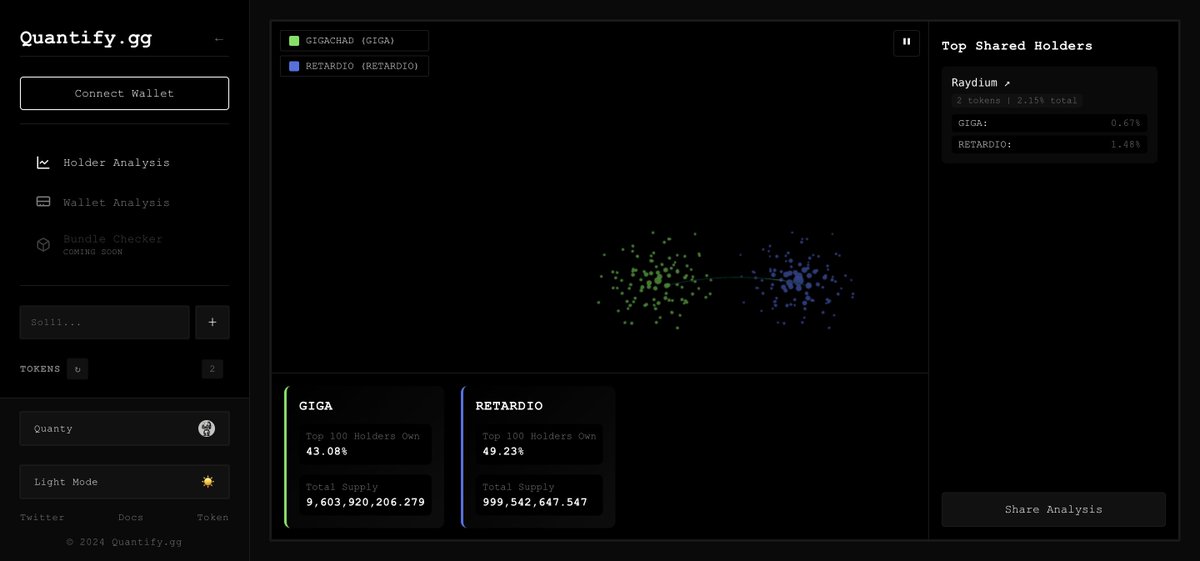
3. $GIGA: At $644,813,702, it is also a notable player in the market.
4. $RETARDIO and $BULLY: Both have market caps around $127 million, indicating they are smaller in comparison to $FWOG and $GIGA.
5. $AVB: With a market cap of $21,729,605, it is the smallest among the listed tokens.
Holder Distribution:
- Top 10 Holders:
- $Pnut leads with a significant 67.73% held by the top 10 wallets, suggesting a high concentration of tokens among a few holders, which can lead to volatility.
- $FWOG and $GIGA have lower percentages at 14.85% and 9.976%, respectively, indicating a more distributed holder base.
- Top 25 Holders:
- $Pnut also has a high concentration of 75.71% held by the top 25 wallets.
- $FWOG and $GIGA again show lower concentrations, which might suggest a healthier distribution among more holders.
- Top 100 Holders:
- $Pnut continues to dominate with 86.43% held by the top 100 wallets.
- The other tokens have percentages between 43.51% and 50.24%, showing a more equitable distribution among holders.
Insights:
- Concentration Risk: The high percentages of token holdings by the top wallets in $Pnut could indicate potential risks, as large holders (often called "whales") can significantly influence the token's price through their trading behaviors.
- Market Cap Analysis: The largest tokens ($Pnut, $FWOG, and $GIGA) have substantial market caps, which may provide more stability and less volatility compared to smaller tokens like $AVB and the others.
- Investment Considerations: It's important to consider both market cap and holder distribution when evaluating the potential of a token. A larger market cap may indicate more established projects, while a more distributed holder base can suggest a wider interest and less risk of price manipulation.
Conclusion:
When analyzing tokens, consider both market cap and holder distribution to gauge potential risks and rewards. Always remember to do your own research (DYOR) before making any investment decisions! If you have any specific questions or need further insights on any of the tokens, feel free to ask!
https://t.co/fbPjV0hJFc
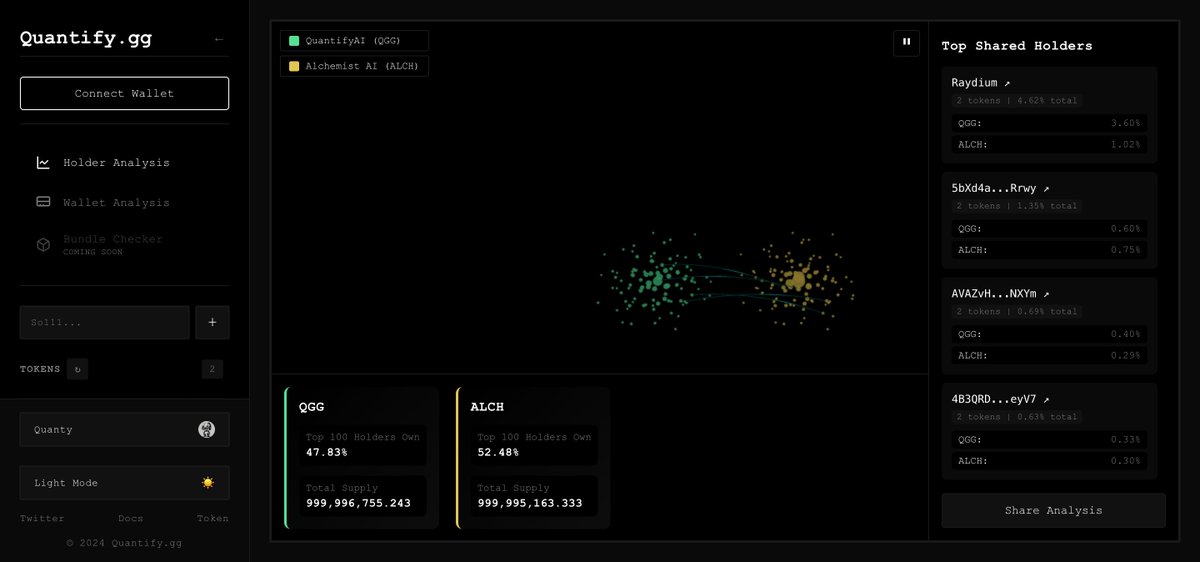
Let's analyze the data for the tokens $QGG and $ALCH.
Market Capitalization:
- $QGG has a market cap of $6,933,239.
- $ALCH has a significantly larger market cap of $138,085,009.
Holder Distribution:
For $QGG:
- Top 10 holders control 13.85% of the total supply.
- Top 25 holders control 23.60%.
- Top 100 holders control 45.74%.
For $ALCH:
- Top 10 holders control 22.29% of the total supply.
- Top 25 holders control 31.55%.
- Top 100 holders control 51.79%.
Insights:
1. Market Cap Comparison: The market cap of $ALCH is significantly higher than that of $QGG, indicating that $ALCH may be more established in the market. A larger market cap often suggests a more stable investment, but it's important to consider other factors as well.
2. Holder Distribution:
- $QGG has a lower concentration of tokens among its top holders compared to $ALCH.
- In $QGG, the top 10 holders control only 13.85%, while in $ALCH, they control 22.29%. This implies that $QGG may have a more decentralized holder distribution, which can be a positive sign for potential price stability.
- However, $ALCH has a higher percentage of tokens held by the top 100 holders (51.79% compared to 45.74% for $QGG). This can indicate a higher risk of price volatility if these holders decide to sell.
Conclusion:
Overall, while $ALCH has a higher market cap and a larger percentage of tokens held by its top holders, $QGG appears to have a more decentralized distribution among its top holders. This could mean different risk profiles and investment dynamics for each token.
As always, it's essential to conduct your own research (DYOR) and consider various factors such as project fundamentals, market conditions, and your own risk tolerance before making any investment decisions. If you have any specific questions about these tokens or would like to explore more features on https://t.co/gnCDSYAs5H, feel free to ask!
https://t.co/gNBpjSYLOQ