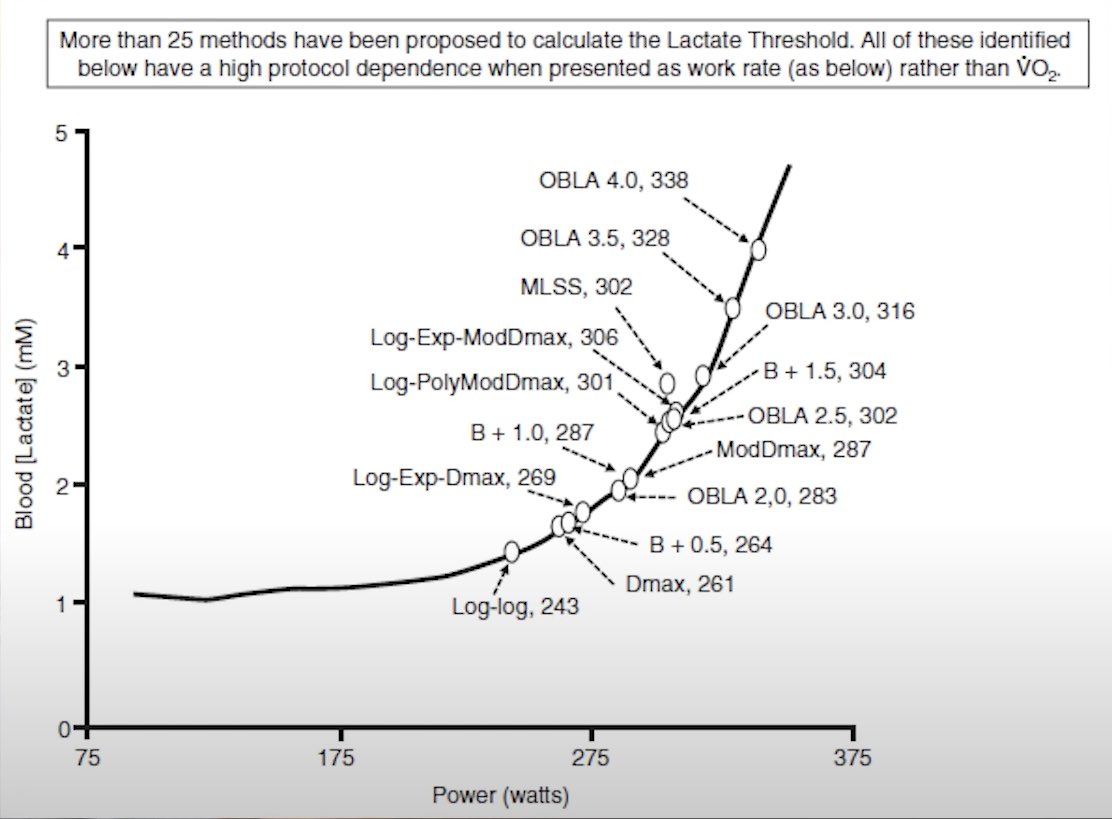
@JasonFitz1 First, define “threshold”, because such a thing doesn’t exist. Also, which threshold are you even talking about?
Just because Norwegians show lower lactate values during those sesh doesn’t mean they’re training at a lower intensity than athletes said to be working “at threshold
@CoachJosse@jb_morin@KenClarkSpeed Do you think this correlation would still hold over a longer sprint at max velocity, where elastic rebound plays a bigger role?
@Nyborger_Nybo@JasonFitz1 Yes 1.6 gmin is MFO in healthy middle-aged individuals, but a ~2 h marathon athlete may reach ~1.6 gmin fat oxidation at ~85% VO₂max, combined with reasonable rates of CHO oxidation (~1.5 gmin), for ~21 kcalmin Given that @kilianj did ~18.8 kcalmin for 14 h, this seems plausible
@Nyborger_Nybo@JasonFitz1 They don't neglect the math—Figs 25 & 26 specifically model those oxidation limits and acknowledge the higher O2 cost of fat.
I see many (valid) critics but this isn't a performance manual for elites, it’s a mechanistic deconstruction of fatigue (EIH,Small Glucose Pool)
@Nyborger_Nybo@Alan_Couzens When I first read the study, I thought, “That’s not proof of a causal relationship.” Then I saw your comment under Alan’s post and realised I wasn’t the only one
I believe this is a great example of why we should stop thinking our body as a machine but as something more complex where interactions between systems and organisms are often more important than the functions of a system if we isolate it.
@EliasLehtonen@JimGalanes This pattern just shows there’s an intensity where lactate appearance outpaces disposal. As intensity rises, blood flow to lactate-consuming tissues drops while more fibers are recruited, raising lactate. It may look like a breakpoint, but the mechanisms are gradual (no MMSS)
@stevemagness Fair enough. I can respect the accountability.
I saw you once mention gains in VO₂peak and running economy from the L-carnitine trial — was it really a ~1L infusion (like some experts said), and how soon after did you notice the effects?
@JimGalanes@MrMoelmen If we matched leg well-being (or another internal load marker), evenly spaced training might show equal or better adaptations. Block group likely adapted more because they trained harder, not because blocks are inherently superior.
@JimGalanes@MrMoelmen The key point is training density. MIT blocks didn’t increase load vs. REG — just condensed it. That density → more adaptation. Would’ve been great if they measured leg well-being — same TRIMP, but likely more (good) fatigue in block group = more stimulus.