🚨 THIS S&P 500 CHART IS SCARY
I compared today’s S&P 500 with the Dot-Com Bubble.
The structure is starting to look almost identical.
Same sharp correction → same recovery → same push toward new highs.
And now valuations are at levels rarely seen in history while retail demand remains near record highs.
1999 → Dot-Com Bubble
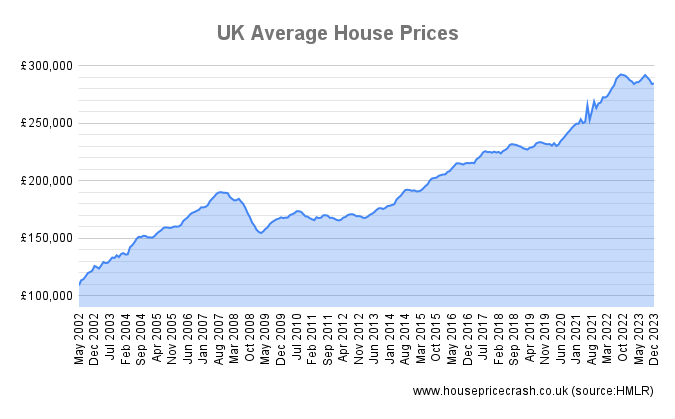
2007 → Housing Bubble
2026 → AI Bubble?
If this pattern keeps following the Dot-Com path, the real crash hasn’t even started yet.
Everyone thinks this time is different.
That’s exactly what scares me.