VERY IMPORTANT CHART 🚨
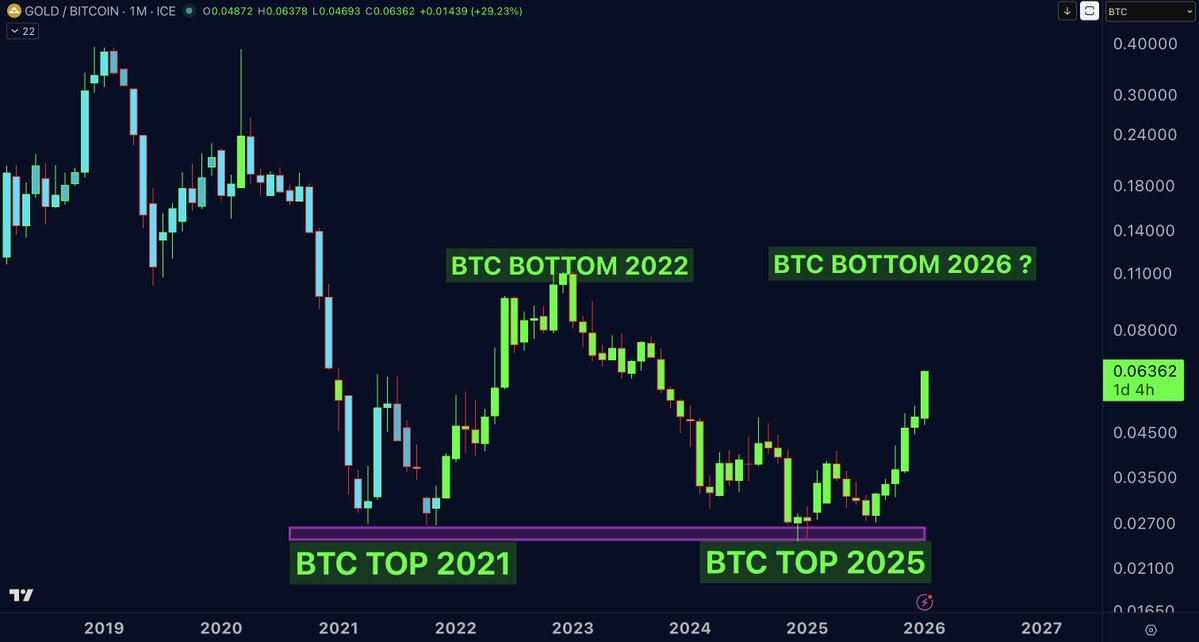
I have shared this $GOLD/ $BTC chart almost a year ago, pointing out that once 0.02 Bitcoin equal 1 gold ounce, it should be considered the top for BTC, and 0.11 BTC equal 1 gold ounce should be considered the bottom for BTC! This happened in 2021 during the Bitcoin top, and during the Bitcoin bottom in 2022. Again, my analysis proved right this year by calling the Bitcoin top at $125,000 at a price of 0,02 BTC for one Gold ounce! Will we see the Bitcoin bottom again at 0.11 BTC for one Gold ounce ?
If we do the math, 1 BTC = $5,500 (gold price) / 0.11 ≈ $50,000, which matches my analysis of Bitcoin’s bottom for this cycle between $50k–$60k. It is playing out exactly as expected. If we calculate with a gold price of $7,000, the equivalent BTC bottom comes in around $63,000, which also aligns with my bottom target. In my opinion, Gold will continue to outperform BTC in the coming months.
This is no financial advice and educational content only
#Bitcoin
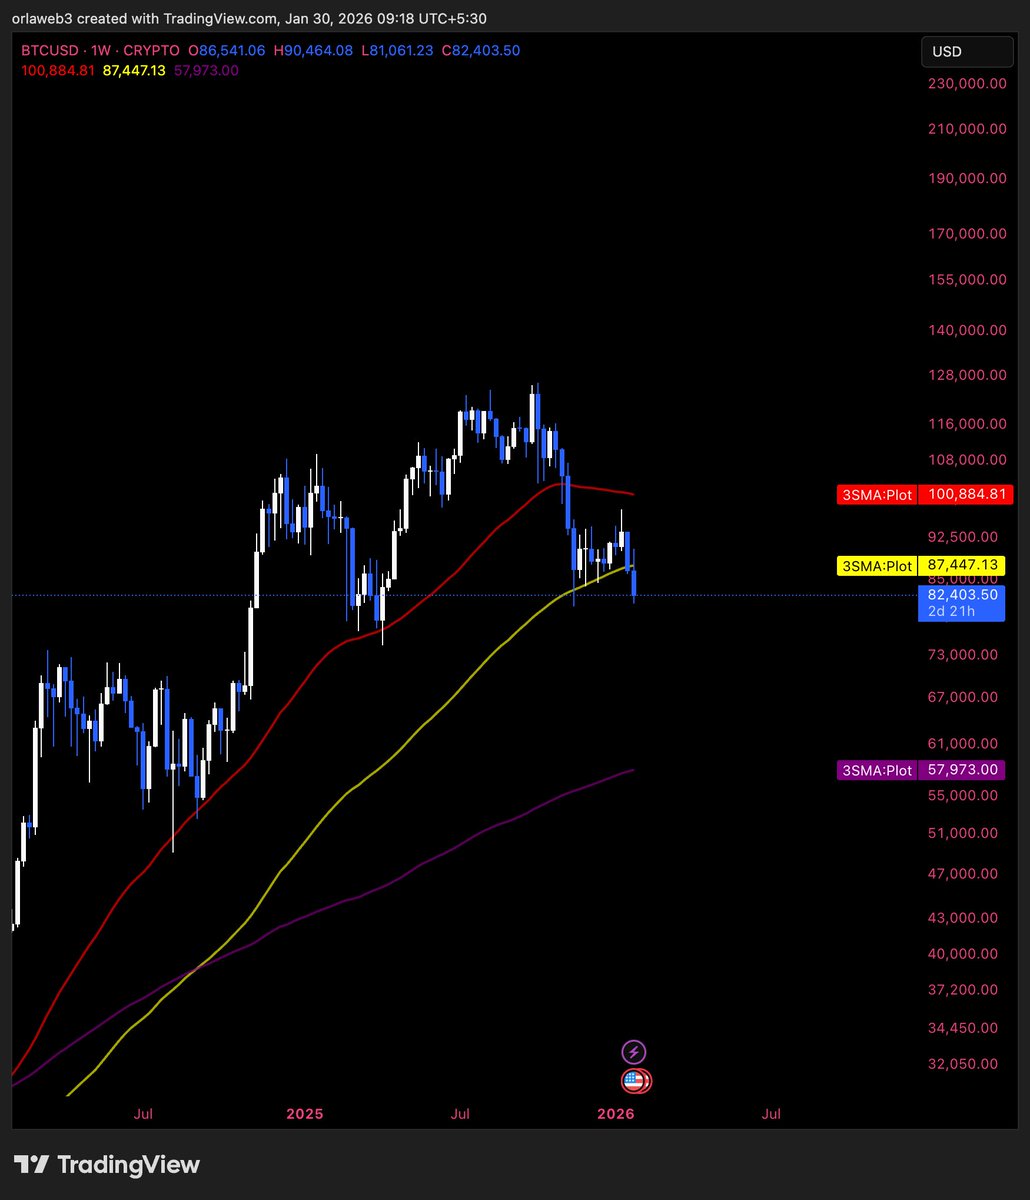
First they said the SMA 50 on the weekly shouldn't break.
Then they said the SMA 100 on the weekly is holding well.
Now they'll keep you bullish until the SMA 200 on the weekly, but the problem is #Bitcoin will be around the 50k area by then.
Technical analysis is nothing without execution.
If you still argue that #Bitcoin is not in a bear market, you're in delusion.