Lemon Tree Hotels CMP: 117
🍋 LEMON TREE HOTELS: BREAKING ABOVE 200 EMA AS WINTER TOURISM & WEDDING SEASON APPROACHES!
Lemon Tree Hotels is showing encouraging price momentum, with the stock sustaining above its 200 EMA for the first time since January 13.
But the interesting part is not just the technical breakout. There is also a broader industry theme developing around the Hotels & Hospitality sector.
We are entering the peak winter tourism and wedding season, which could support demand across hotels, resorts, banquets and destination wedding properties.
Let's understand the opportunity.
📊 1. STRONG Q2FY27 RESULTS
Lemon Tree Hotels reported an encouraging set of September-quarter results:
Total revenue: ₹363.8 crore, up 18% YoY.
Net EBITDA: ₹162.2 crore, up 22% YoY.
Net EBITDA margin: 44.6%, compared with 43% last year.
Net profit (PAT): ₹79.8 crore, up approximately 90% YoY.
Cash profit: ₹97.2 crore, up 28% YoY.
The company also reported:
Gross ARR of ₹6,751, up 8% YoY.
Occupancy of 76.1%, improving 633 basis points.
RevPAR of ₹5,137, up 18% YoY.
These numbers indicate improvement in both room pricing and occupancy, supporting stronger operating performance.
🏨 2. RAPID EXPANSION OF THE HOTEL NETWORK
Lemon Tree is aggressively expanding its presence across India.
As of September 30, 2026:
138 operational hotels.
12,131 operational rooms.
147 upcoming hotels.
11,930 rooms in the development and signing pipeline.
Presence across 170+ cities through its combined operational and pipeline network.
During Q2 FY27 alone:
8 managed and franchised hotels with 523 rooms were opened.
11 additional hotels with 825 rooms were signed.
The company is also expanding its premium portfolio, including projects in Shimla, Shillong, Varanasi and Mumbai.
This expansion could strengthen its long-term revenue and management-fee opportunities.
🌍 3. WHY THE HOTELS & HOSPITALITY SECTOR COULD BE INTERESTING NOW
One theme worth tracking over the next 3–4 months, from November 2026 to February 2027, is the seasonal demand opportunity.
We are entering two important periods:
Peak winter tourism.
India's wedding season.
Both can support hotel occupancy, room rates, banquets, food and beverage revenue, and destination wedding bookings.
📈 4. THE DATA SUPPORTING THIS INDUSTRY THEME
ICRA's FY2027 outlook:
India's hospitality industry is projected to record 7–9% revenue growth in FY2027.
Premium hotel occupancy is expected to remain around 72–74%.
Growth is expected to be supported by domestic leisure travel, weddings, MICE activities and business travel.
Hotel occupancy and room rates:
ICRA's September 29, 2026 update estimated:
Premium hotel occupancy at 67–69% in H1 FY2027, compared with 65–67% in H1 FY2026.
Average room rates at ₹8,000–₹8,200, compared with ₹7,700–₹7,900 in the previous year.
These figures indicate improving demand and pricing across the premium hotel industry.
Wedding-season demand:
A September 2026 report by The Economic Times highlighted:
Hotels are witnessing strong bookings for the upcoming wedding season.
Several popular wedding destinations have already seen prime dates reserved.
January–March 2027 bookings and enquiries are arriving 4–6 months in advance.
Hilton reported that its wedding revenue pipeline for the next year was over 50% ahead of the same period last year.
Sayaji Hotels reported 77% YoY growth in wedding revenue and a 50% increase in wedding enquiries.
This is important because wedding demand can generate revenue across accommodation, banquet facilities, food and beverage services and multi-day celebrations.
🔍 5. WHY LEMON TREE COULD BENEFIT
Lemon Tree operates across multiple hotel categories, from economy and midscale properties to premium hotels and resorts.
This gives it exposure to different types of hospitality demand.
The combination of:
Improving occupancy and room rates.
Growing domestic tourism.
Wedding-season demand.
Expansion into new cities.
A growing managed and franchised hotel network.
Could provide additional growth opportunities for the company.
However, the extent of the benefit will depend on individual property performance, execution, competition and operating costs.
📉 6. TECHNICAL PICTURE
From a technical perspective, the stock is showing encouraging signs.
The stock has broken above its 200 EMA.
It is sustaining above this long-term moving average for the first time since January 13.
The breakout suggests a potential improvement in the longer-term trend.
Sustained price action above the 200 EMA would be important to monitor for confirmation.
The next thing to watch is whether the stock can maintain this breakout and build a stronger price structure.
🎯 OUR RESEARCH APPROACH
This is how a research analyst should approach a sector.
Don't wait until every stock has already rallied. Identify the industry theme, understand the demand drivers, study the financial performance and then shortlist businesses showing improving technical momentum.
For Lemon Tree, the combination of strong Q2 numbers, network expansion, improving occupancy and the upcoming seasonal demand cycle makes it an interesting company to track.
But a promising industry theme does not automatically make every stock a good investment. Valuation, debt, cash flows, execution and technical confirmation remain important.
The objective is to identify opportunities early, research them properly and prepare before the broader market starts paying attention.
Sources: Lemon Tree Hotels Q2 & H1 FY27 Investor Presentation (November 5, 2026); ICRA hospitality industry outlook (September 29, 2026); The Economic Times wedding-season report (September 2026).
Disclaimer: This content is for educational and research purposes only. It is not a buy/sell recommendation. Please conduct your own research before making investment decisions.
My biggest #investing regrets are not the stocks I DID NOT BUY, but the stocks I SOLD too early! 🤦♂️
VERY Recent (2026) examples :
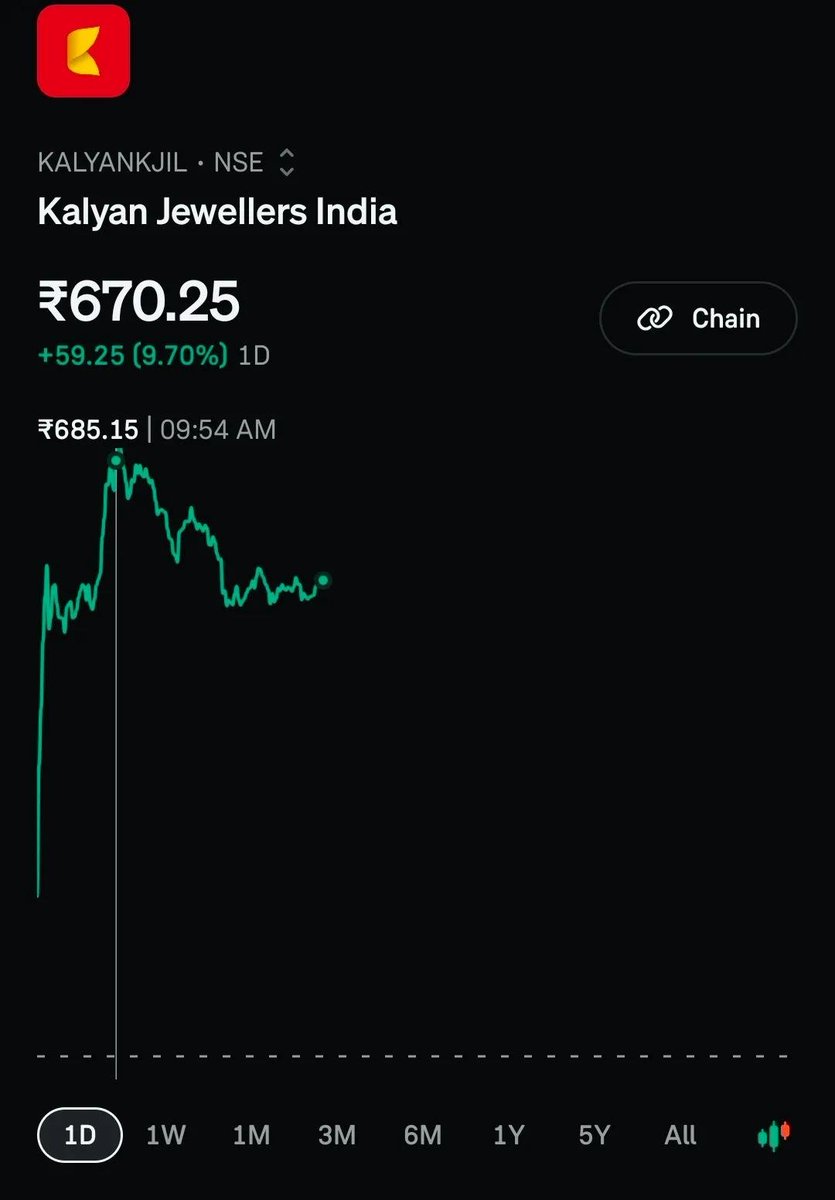
Kalyan Jewellers (July, 2026):
• Bought at ₹398 on 9th July, sold at ₹482 on 10th July, 2026
• Held for just 1 day
• Capital: ₹1.19L
• Profit booked: ₹25,200 (+21.1%)
Current price: ₹670.25 (+68.4% from my buying price).
Could have made much more by simply holding for 4 months!
An expensive lesson in patience!
This is what analysis looks like 😎
Shared Crompton Greaves Consumer Electricals at 198, Made a high of 223(~10% Profits within 1 week even in this Market📷)
If you're not following me, you will never see me again. So have a good day!
Crompton Greaves Consumer Electricals CMP: 198
Crompton Greaves Consumer Electricals Ltd. | Multi-Year Support Zone 📊
🔹 1. Major Historical Support: ₹190–200
The stock is currently trading near the ₹190–200 zone, which has acted as a significant support and accumulation area in the past. Price has bounced from this zone on multiple occasions, making it an important level to watch again.
🔹 2. Valuation Looks Relatively Attractive
The reported P/E is around 26.1, which is claimed to be near its lowest level in the last five years. If verified against consistent historical data, this could indicate a more reasonable valuation compared with its past trading range.
🔹 3. Strong Quarterly Performance
The latest Q2 FY27 results were encouraging:
Revenue increased 18.2% YoY to ₹2,263 crore.
EBITDA grew 24.1% YoY to ₹205 crore.
Net profit rose approximately 65% YoY to ₹124 crore.
EBITDA margin improved to around 9%.
These numbers indicate healthy growth in revenue and profitability, although future performance and valuation will remain important.
🔹 4. Technical Structure Still Needs Confirmation
Despite the stock approaching a major historical support zone, the monthly chart remains weak:
Price is trading below the 9, 20 and 50-month EMAs.
RSI is near 35, indicating weak momentum.
MACD remains bearish.
Therefore, the stock is at an important support area, but a confirmed bullish reversal has not yet emerged.
⚠️ 5. Stop-Loss (SL) Becomes Crucial Here
Historical support zones can fail, especially when the broader trend is bearish. If the ₹190–200 zone breaks decisively, the stock could face further downside.
Anyone considering a trade should define their risk in advance and use a suitable stop-loss based on their entry, risk tolerance and trading timeframe. Avoid entering solely because the stock has reached support, and do not assume that a previous bounce guarantees another one.
Conclusion: Crompton is approaching a significant multi-year support zone, supported by encouraging quarterly results and potentially attractive valuations. However, the technical trend remains weak. Watch for price stabilisation and reversal confirmation, while keeping risk management and stop-loss discipline a priority.
For educational purposes only. This is not a buy or sell recommendation.
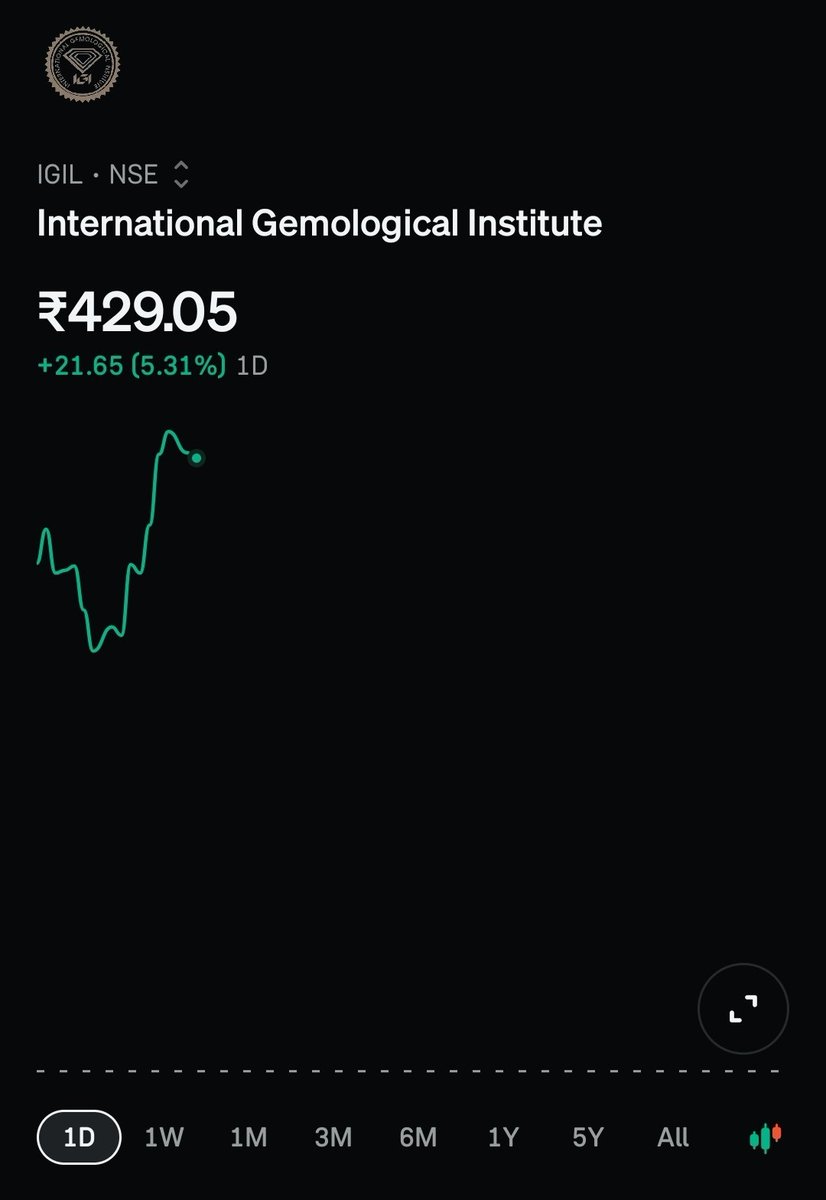
IGIL CMP: 403
IGIL (International Gemmological Institute) | Breakout + Massive Volume 🚀
1️⃣ Strong Breakout Above Resistance
IGI has delivered a strong weekly breakout above its long-standing resistance zone around ₹365–375. The stock is at ₹403.10, up 6.02% for the week, with a high of ₹406.20.
The breakout candle indicates strong buying interest, with price moving decisively above the previous consolidation range.
2️⃣ Massive Volume Expansion 📊
Weekly volume reached approximately 6.68 million shares. Based on the chart, this is among the highest volume readings since listing, excluding the exceptional activity immediately after listing.
A breakout accompanied by a sharp increase in volume is generally more convincing than a low-volume move, as it suggests broader participation. However, sustained buying in the coming weeks will help confirm the breakout's strength.
3️⃣ Excellent Q2 FY27 Results 📈
IGI reported strong consolidated results for the September 2026 quarter:
Revenue: ₹398 crore, up 31% YoY.
EBITDA: ₹244.5 crore, up approximately 39% YoY.
Net profit: ₹185.8 crore, up approximately 43% YoY.
H1 FY27 revenue: ₹768.8 crore, up 27% YoY.
H1 FY27 net profit: ₹351.6 crore, up 37% YoY.
The company also reported issuing 4.35 million reports during Q2, an increase of 26% year-on-year. This points to strong growth in its certification business.
4️⃣ A Leader in Jewellery Certification 💎
IGI operates in the gemological testing, grading and certification business. Its reports help buyers, jewellery manufacturers, retailers and other industry participants assess the characteristics and quality of diamonds, gemstones and jewellery.
According to the company's historical disclosures:
It held approximately 33% of the global diamond-certification market.
It held around 65% of the lab-grown diamond certification market.
It reported serving 9 out of 10 jewellery chain stores in India.
These figures demonstrate its strong competitive position, although the market-share figures relate to historical reporting and should not be treated as independently verified current-year estimates.
5️⃣ Technical Indicators Support the Breakout
The weekly chart shows several encouraging signals:
Price: ₹404.10, comfortably above the ₹365–375 resistance zone.
9-week EMA: ₹350.43.
20-week EMA: ₹344.74.
50-week EMA: ₹349.09.
RSI: 66.11, reflecting improving bullish momentum without yet entering the conventional overbought zone.
MACD: The latest histogram bars have turned positive, supporting the improvement in momentum.
The price is now above all three displayed short- and medium-term EMAs. The 200-week EMA value is not visible in the chart, so it cannot be assessed reliably from this screenshot.
6️⃣ What Should We Watch Next?
The ₹365–375 zone is now the key area to monitor. If the stock holds above this former resistance zone on a retest, it would strengthen the breakout structure. Continued volume and follow-through buying would provide further confirmation.
However, after a sharp upward move, profit-booking and a retest are possible. A decisive move back below the breakout zone would weaken the setup.
Risk management remains essential: traders should define their stop-loss according to their timeframe and risk tolerance rather than chasing the breakout after a large candle.
Conclusion: IGI presents an interesting combination of a strong technical breakout, significant volume expansion, robust quarterly growth and an established position in diamond and jewellery certification. The setup looks constructive, but follow-through and the stock's ability to hold above the breakout zone will be important for confirmation.
For educational purposes only. This is not a buy or sell recommendation.
MOCAPITAL CMP: 57 – AN ETF TO TRACK THE CAPITAL MARKET SECTOR! 📈
Following our recent discussion on the capital-market sector, one ETF worth tracking is the Motilal Oswal Nifty Capital Market ETF (MOCAPITAL).
With rising retail participation, increasing institutional activity and the long-term growth potential of India's capital markets, I remain bullish and optimistic about this sector.
I believe this ETF deserves a place on our research watchlist.
Note: This is my personal opinion and market outlook, not a buy/sell recommendation. Do your own research before investing.
FII BUYING IS BACK? WHICH SECTOR COULD BENEFIT THE MOST?
Look closely at the recent FII activity. There is an interesting shift happening in the Indian stock market.
For quite some time, FIIs were aggressively selling Indian equities. However, we are now witnessing a change in their activity.
Look at the latest cash-market data:
- 27 October: FII net buying of ₹4,240 crore
- 28 October: FII net buying of ₹872 crore
- 29 October: FII net selling of ₹944 crore
- 30 October: FII net buying of ₹3,599 crore
- 2 November: FII net buying of ₹3,115 crore
- 3rd Nov: +6836 Cr 🟩
- 4th Nov: +7,284.03Cr 🟩
- 5th Nov: ₹14,974.7 cr 🟩
- 6th Nov: ₹13,750 cr 🟩
FIIs were net buyers in 4 out of the last 5 sessions of October. Even on 2 November, they continued their buying.
In fact, their cumulative net buying over the last five trading sessions (27 October–2 November) stands at approximately ₹10,882 crore.
This is an important shift worth monitoring.
Now, here's something interesting to understand.
If FIIs continue returning to the Indian market, which businesses could benefit irrespective of which individual stocks they choose to invest in?
One sector that deserves attention is the CAPITAL MARKET SECTOR.
Think about it:
Whenever institutional and retail participation in the equity market increases, several businesses in the capital-market ecosystem can benefit.
- Stock exchanges earn revenue from trading activity and transaction volumes.
- Brokerage firms benefit from higher trading activity and client participation.
- Depositories benefit from demat accounts and securities-related transactions.
- Registrar and transfer agents benefit from IPO activity and mutual fund business.
In other words, increased participation in the equity market can create opportunities across the capital-market ecosystem.
OUR OBSERVATION:
Capital-market stocks have already started showing strength. The sector also gained around 10% during this week of October - Nov, according to reported sector data.
If we are looking at investment opportunities for the next few years, I believe capital-market businesses deserve a place on our research watchlist.
Rather than trying to predict exactly which stocks FIIs will buy, we should also study businesses that provide the infrastructure and services supporting the entire market ecosystem.
The bigger opportunity may not always be in identifying where the money goes, but also in identifying the businesses that benefit when more money enters the market.
Start studying fundamentally strong capital-market companies. Look at their valuations, earnings growth, business models and long-term prospects.
Don't chase stocks just because they are moving up. Research first, then act.
Learn. Analyse. Grow.
FII BUYING IS BACK? WHICH SECTOR COULD BENEFIT THE MOST?
Look closely at the recent FII activity. There is an interesting shift happening in the Indian stock market.
For quite some time, FIIs were aggressively selling Indian equities. However, we are now witnessing a change in their activity.
Look at the latest cash-market data:
- 27 October: FII net buying of ₹4,240 crore
- 28 October: FII net buying of ₹872 crore
- 29 October: FII net selling of ₹944 crore
- 30 October: FII net buying of ₹3,599 crore
- 2 November: FII net buying of ₹3,115 crore
- 3rd Nov: +6836 Cr 🟩
- 4th Nov: +7,284.03Cr 🟩
- 5th Nov: ₹14,974.7 cr 🟩
- 6th Nov: ₹13,750 cr 🟩
FIIs were net buyers in 4 out of the last 5 sessions of October. Even on 2 November, they continued their buying.
In fact, their cumulative net buying over the last five trading sessions (27 October–2 November) stands at approximately ₹10,882 crore.
This is an important shift worth monitoring.
Now, here's something interesting to understand.
If FIIs continue returning to the Indian market, which businesses could benefit irrespective of which individual stocks they choose to invest in?
One sector that deserves attention is the CAPITAL MARKET SECTOR.
Think about it:
Whenever institutional and retail participation in the equity market increases, several businesses in the capital-market ecosystem can benefit.
- Stock exchanges earn revenue from trading activity and transaction volumes.
- Brokerage firms benefit from higher trading activity and client participation.
- Depositories benefit from demat accounts and securities-related transactions.
- Registrar and transfer agents benefit from IPO activity and mutual fund business.
In other words, increased participation in the equity market can create opportunities across the capital-market ecosystem.
OUR OBSERVATION:
Capital-market stocks have already started showing strength. The sector also gained around 10% during this week of October - Nov, according to reported sector data.
If we are looking at investment opportunities for the next few years, I believe capital-market businesses deserve a place on our research watchlist.
Rather than trying to predict exactly which stocks FIIs will buy, we should also study businesses that provide the infrastructure and services supporting the entire market ecosystem.
The bigger opportunity may not always be in identifying where the money goes, but also in identifying the businesses that benefit when more money enters the market.
Start studying fundamentally strong capital-market companies. Look at their valuations, earnings growth, business models and long-term prospects.
Don't chase stocks just because they are moving up. Research first, then act.
Learn. Analyse. Grow.
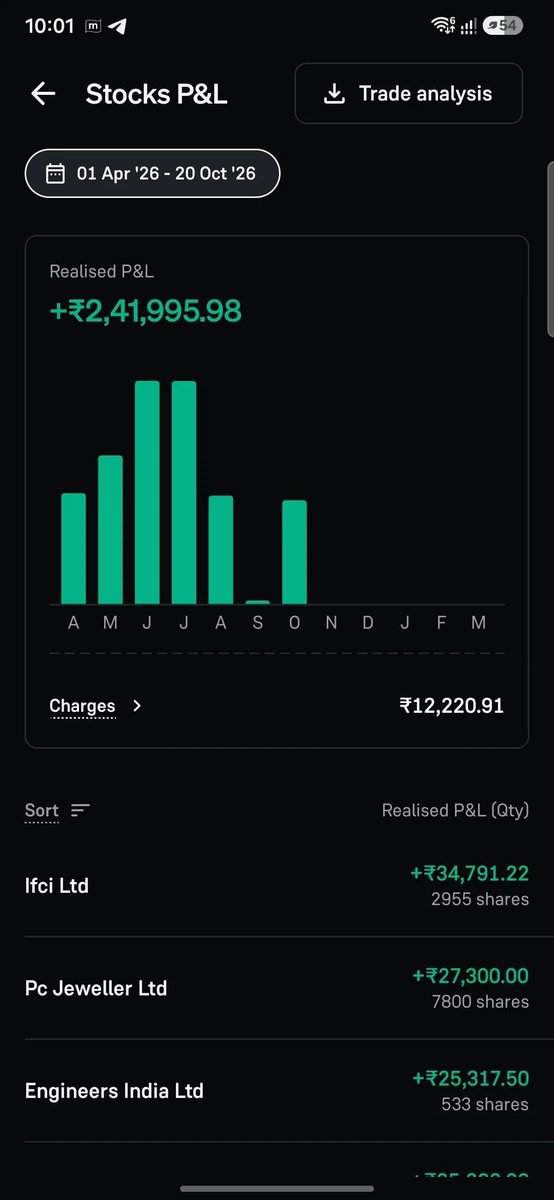
BSE: Shared at ₹3,105, made a high of ₹3,831.30 (~23.39% profit 😲)
Marksans Pharma: Shared at ₹262, made a high of ₹350 (~33.59% profit 😲)
Engineers India: Shared at ₹217, made a high of ₹321 (~47.93% profit 😲)
PC Jeweller: Shared at ₹13.2, made a high of ₹20.10 (~52.27% profit 😲)
If you're not following me, you will never see me again. So, have a good day!
📌 UPCOMING IPOs WITH SHAREHOLDER QUOTA
👉 Keep at least 1 share of the parent company to be eligible for the shareholder quota
1. MAHANANDI COAL
PARENT COMPANY : COAL INDIA LTD
APPROX SH SIZE : 900 CR
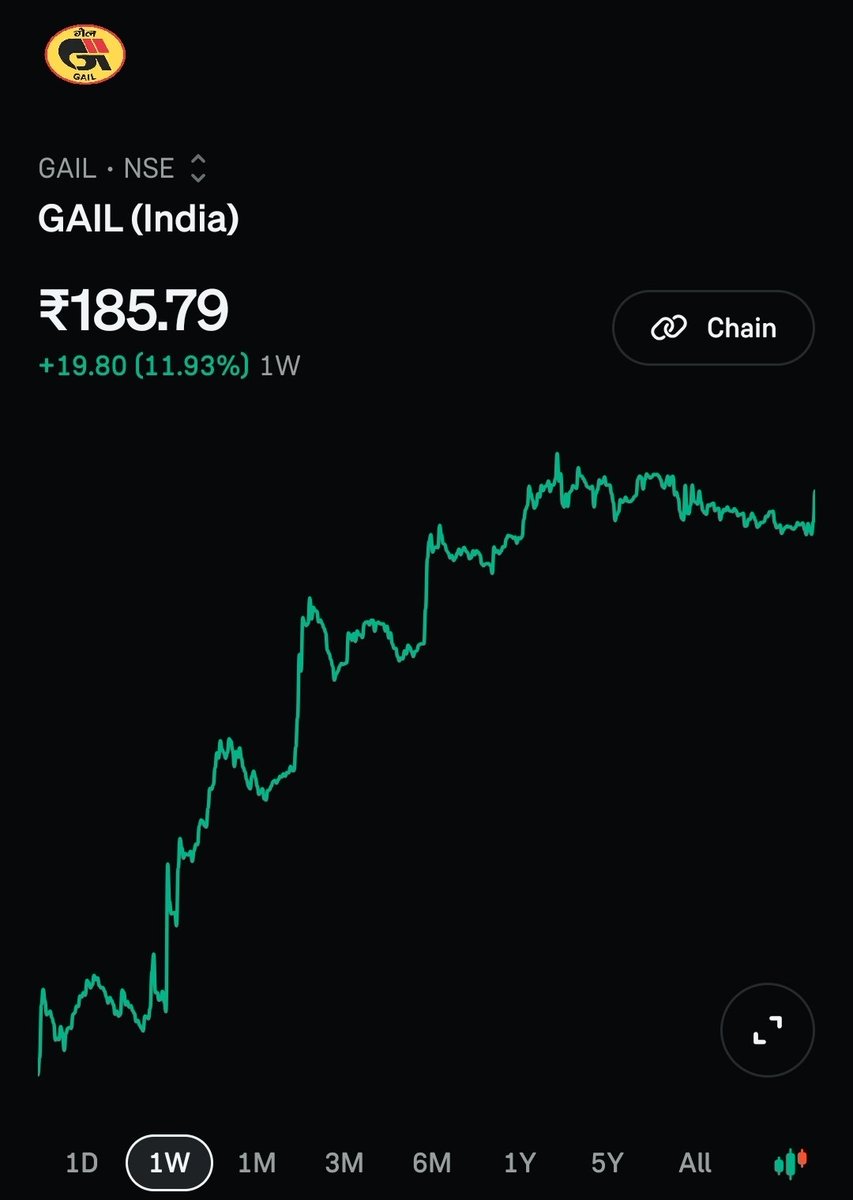
2. GAIL GAS
PARENT COMPANY : GAIL LTD
APPROX SH SIZE : 300 CR
3. JSW ONE
PARENT COMPANY : JSW CEMENT/STEEL
APPROX SH SIZE : 300 CR
📊 FII/DII DATA - NOV 6, 2026
Surprise, surprise!
FIIs are back with a massive buying spree.
🌍 🟢 FII: ₹+13,750 Cr💀
🇮🇳 🔴 DII: ₹-5,969 Cr
📈 Net Institutional Buying: ₹ +7,781 Cr💚
FIIs bought nearly ₹13,750 crore in a single session, while DIIs booked profits worth over ₹6,000 crore.
This the beginning of a fresh FII buying🔥
In April 2020, the Nifty witnessed a massive 12.7% weekly rally, marking the beginning of the historic post-COVID bull market.
Fast forward to November 2026, and the index has surged 9% in a week, recording its strongest weekly performance since February 2021.
Could we be witnessing the early signs of another major bull run? 👀
This is what analysis looks like 😎
Shared Crompton Greaves Consumer Electricals at 198, Made a high of 217.6(~10% Profits within 1 week even in this Market😲)
If you're not following me, you will never see me again. So have a good day!
Crompton Greaves Consumer Electricals CMP: 198
Crompton Greaves Consumer Electricals Ltd. | Multi-Year Support Zone 📊
🔹 1. Major Historical Support: ₹190–200
The stock is currently trading near the ₹190–200 zone, which has acted as a significant support and accumulation area in the past. Price has bounced from this zone on multiple occasions, making it an important level to watch again.
🔹 2. Valuation Looks Relatively Attractive
The reported P/E is around 26.1, which is claimed to be near its lowest level in the last five years. If verified against consistent historical data, this could indicate a more reasonable valuation compared with its past trading range.
🔹 3. Strong Quarterly Performance
The latest Q2 FY27 results were encouraging:
Revenue increased 18.2% YoY to ₹2,263 crore.
EBITDA grew 24.1% YoY to ₹205 crore.
Net profit rose approximately 65% YoY to ₹124 crore.
EBITDA margin improved to around 9%.
These numbers indicate healthy growth in revenue and profitability, although future performance and valuation will remain important.
🔹 4. Technical Structure Still Needs Confirmation
Despite the stock approaching a major historical support zone, the monthly chart remains weak:
Price is trading below the 9, 20 and 50-month EMAs.
RSI is near 35, indicating weak momentum.
MACD remains bearish.
Therefore, the stock is at an important support area, but a confirmed bullish reversal has not yet emerged.
⚠️ 5. Stop-Loss (SL) Becomes Crucial Here
Historical support zones can fail, especially when the broader trend is bearish. If the ₹190–200 zone breaks decisively, the stock could face further downside.
Anyone considering a trade should define their risk in advance and use a suitable stop-loss based on their entry, risk tolerance and trading timeframe. Avoid entering solely because the stock has reached support, and do not assume that a previous bounce guarantees another one.
Conclusion: Crompton is approaching a significant multi-year support zone, supported by encouraging quarterly results and potentially attractive valuations. However, the technical trend remains weak. Watch for price stabilisation and reversal confirmation, while keeping risk management and stop-loss discipline a priority.
For educational purposes only. This is not a buy or sell recommendation.