$BTC → Short-term Long Bias, but still Bearish overall
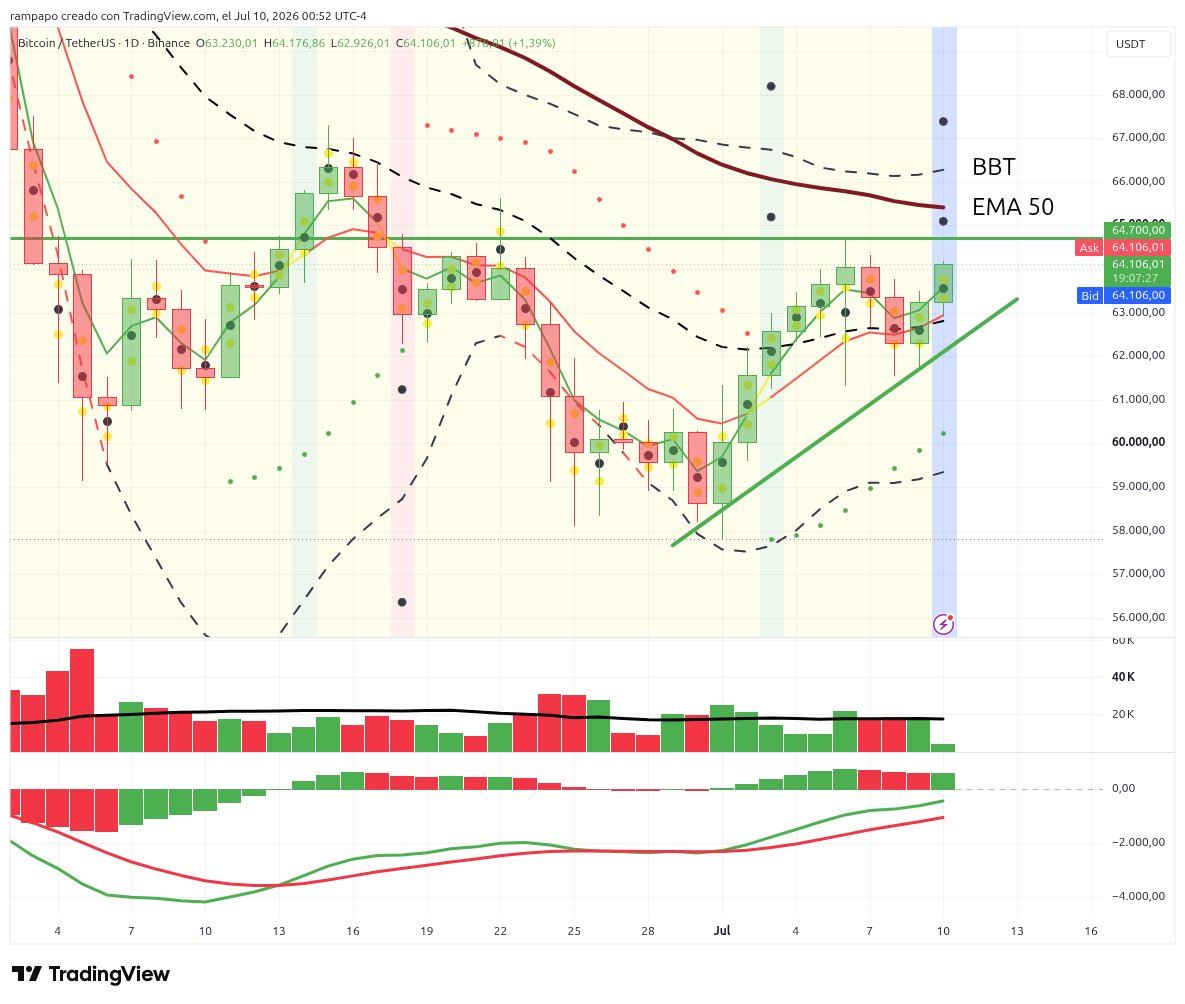
Trading below EMA50. First resistance at 64,700 (July 6 high). Next targets if it breaks: EMA50 (~65,385) and BB Top (~66,253).
EMA200 sits far above at ~75,068 — big gap to fill. Still a lot of work to do for a real bullish reversal.
Status: Cautious short-term long
$ES (S&P 500 Futures) → Bullish Bias, but in short-term range
Price has been consolidating the last 6 days, but remains above all major EMAs on the daily chart → overall bullish structure intact.
To confirm continuation: Need to break Monday’s high and push toward 7,648 – 7,657 zone (recent highs + BB Top).
Status: Bullish bias
Most people chase AI for signals. I use it to keep my premarket read consistent and to review what I got right or wrong after the open. That review loop matters more than any model.
By the time you reach the open, you’re already dealing with conflicting signals across timeframes. That’s where structure becomes more useful than any prediction.
@MEXIT_trades Not really. EMAs are part of my process, but my core strategy isn’t ICT — it’s my own pullback system based on Bollinger structure, key levels, and multi-timeframe confirmation. But yeah, I think we were seeing the same thing. It was a great call and a really solid attempt.
Putting it all together — macro picture right now:
Equities: mixed. $ES structure is clean and just flipped MACD bullish.
$YM cooling off after tagging new highs (indecision candle). $NQ stuck in a triangle, no direction yet.
$ZB (bonds) breaking down — yields likely rising, consistent with risk-on equity flow.
$GC fighting EMA20 resistance, bullish rotation active but far from confirmed.
$BTC bullish on the daily but already fading on the hourly — long-term structure still bearish (death cross intact).
Net read: equities lead, bonds sell off, gold undecided, crypto fragile. Risk-on tilt, but far from clean across the board.
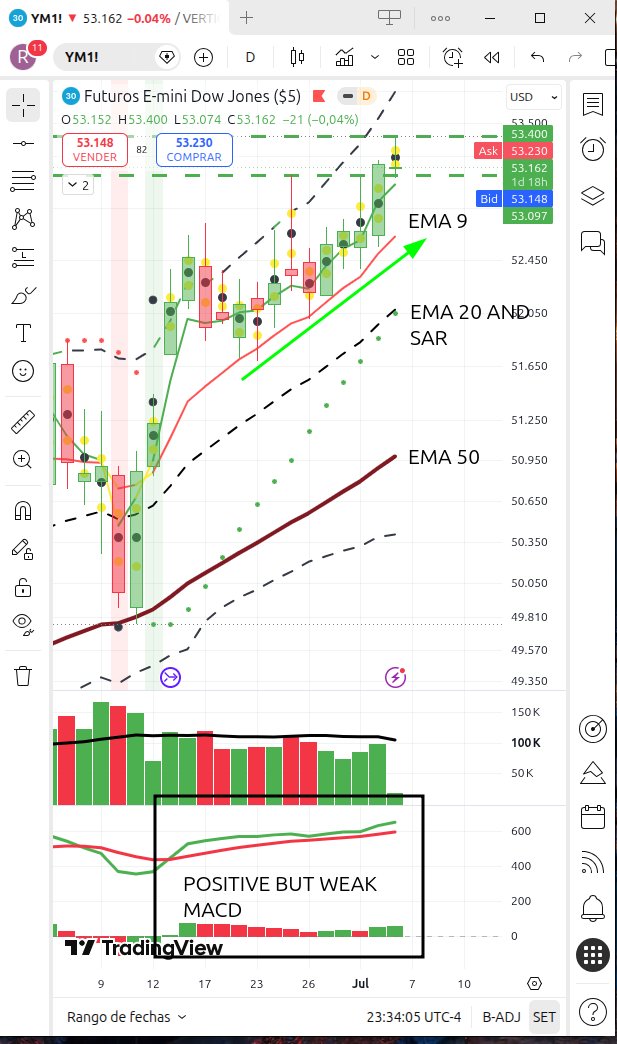
$YM at all-time highs. Euphoria mode — every EMA trending up, SAR bullish.
But that last daily candle closed right at the open after tagging a new ATH (53400). Classic indecision after a run.
MACD positive but weak. Volume decreasing on the way up.
Lose 53162 → pullback to EMA9 (~52610)
No "up" confirmed until 53400 breaks again
🧵
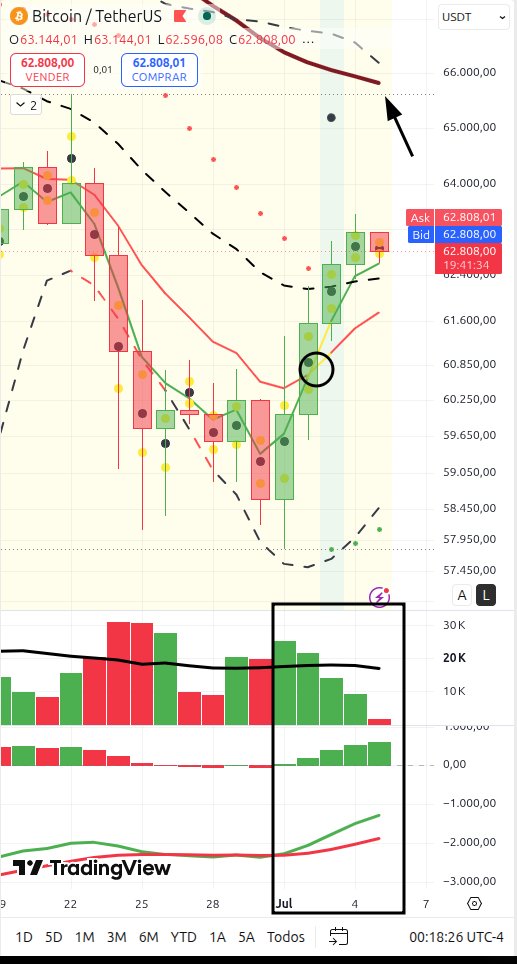
$BTC — daily rotation EMA3/EMA9 bullish, price holding above EMA20. MACD just closed its 4th straight positive histogram.
But that's where the good news ends. EMA50 and EMA200 sit way above with a massive gap between them — death cross fully in effect, hard to unwind fast.
Last month's high (74092) is completely outside the Bollinger range — not reachable near-term.
Hourly already rotating back bearish. BTC looks fragile under the surface.