I built a personal research terminal to find setups and analyze sector rotations using Claude. I've named it YEAGER.
It'll inform my analysis and trading going forward, and I hope it provides insights to the community here.
Here's how it works ⬇️
it's starting to feel like the early days of covid to me
where everyone is still going about their day normally, but at some level you know it's all not real anymore and things will change very soon
@jfsrev How do you personally manage your watchlist (week, month, urgency etc.), and when you run your morning screeners do you review every chart?
Would you discourage only reviewing new additions to the screeners during the week? (With full reviews on the weekend)
@FranVezz I bought on the 29th and exited on the 7th.
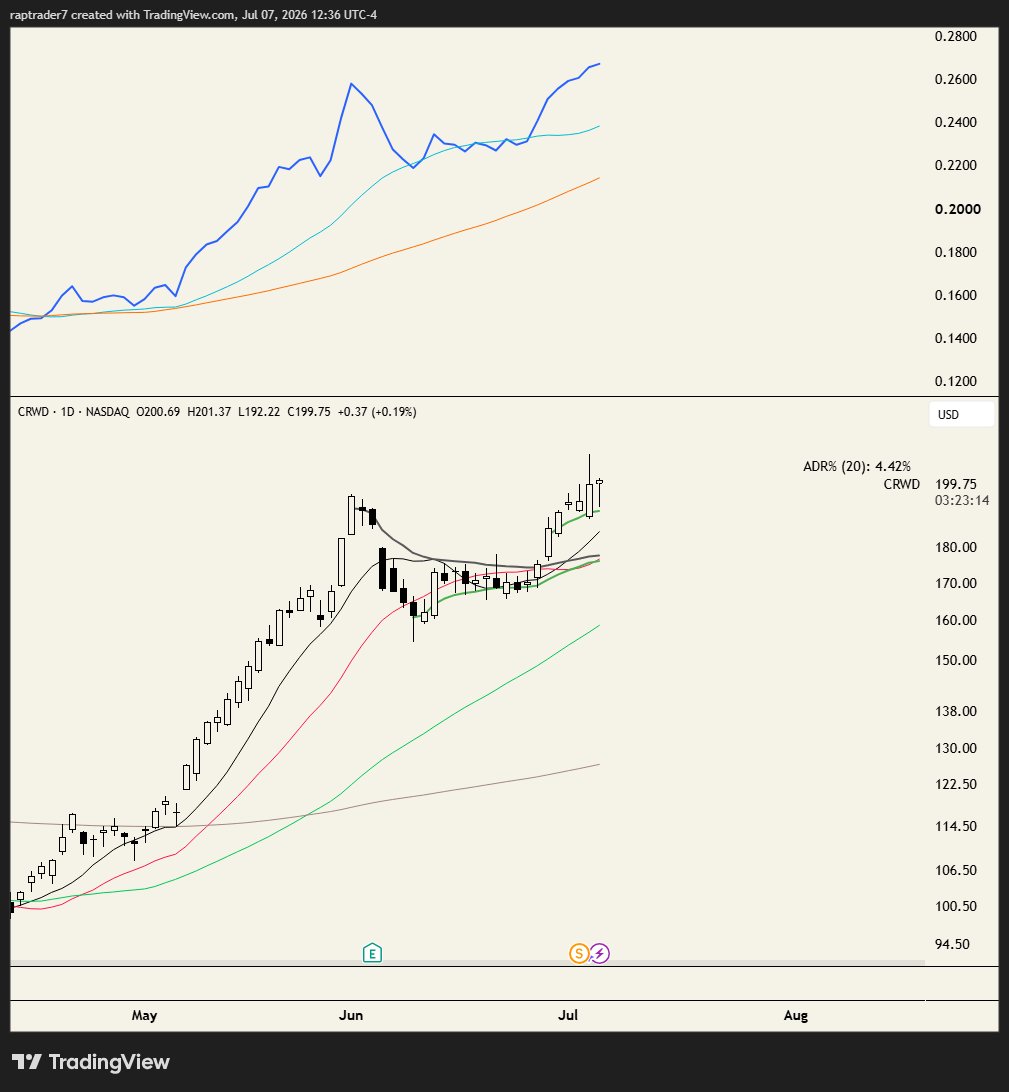
Cant feel like I messed up this trade with the strength in cyber. I know you bought the same day too so can you walk through how you managed it in more detail? Cheers
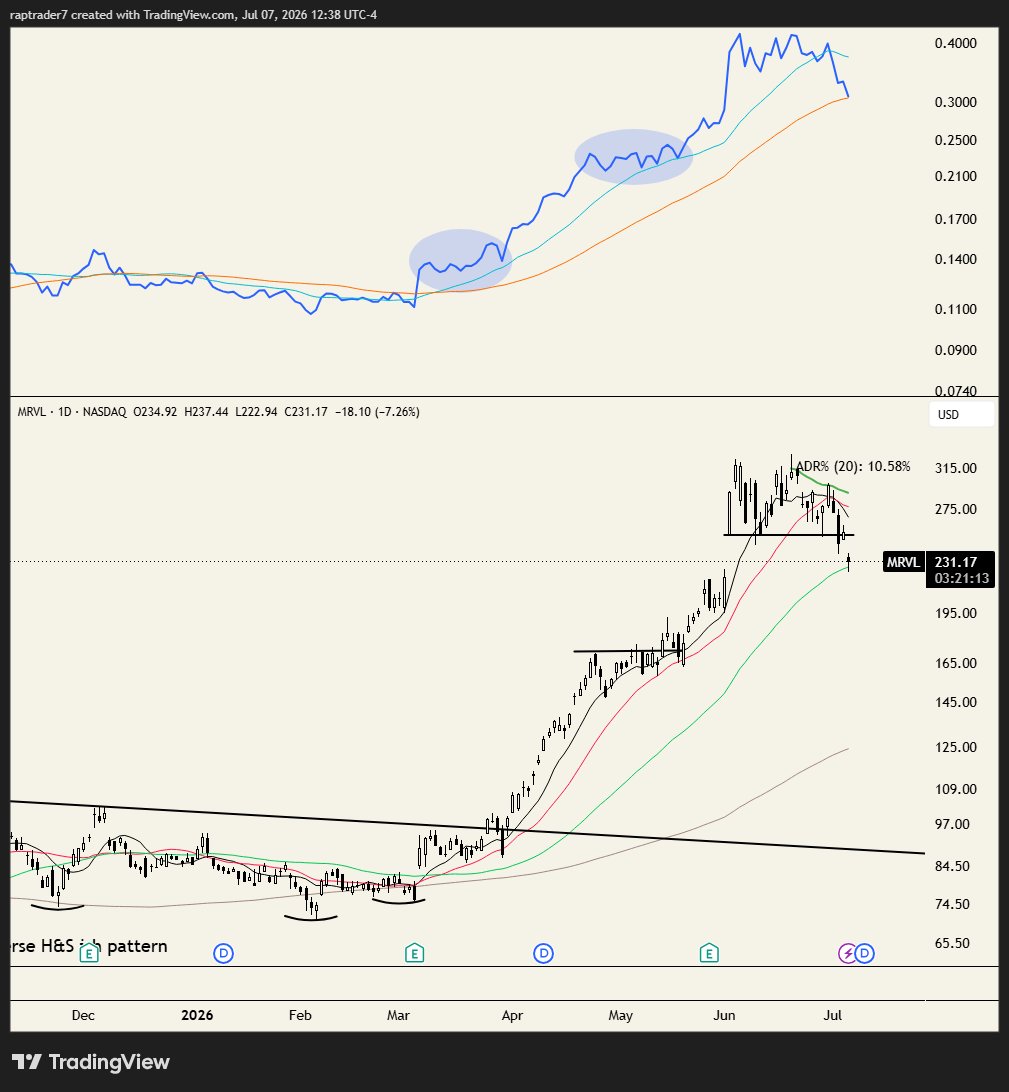
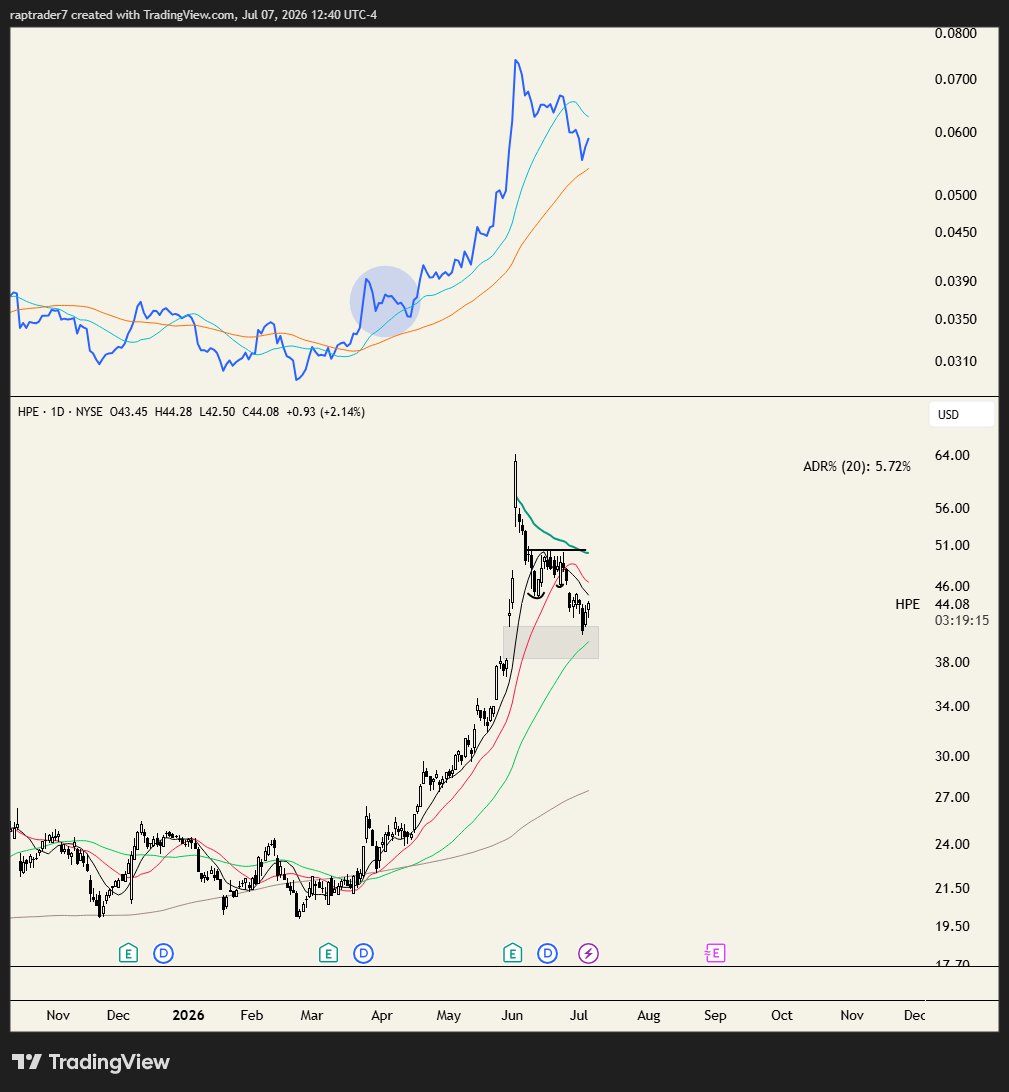
CRWD (trade I'm currently in), MRVL, BE, HPE. If the strategy is buying names which are consolidating in an existing, strong uptrend then you are buying RS regardless of what you call it.
From what I can read, you might be misunderstanding me. Its not necessary that they need high RS at the time of the breakout (although they often do), it's that if you are buying a shorter term consolidation within a longer uptrend, prior RS is statistically a prerequisite. I think you and I also have very different holding periods.
Goes back to my original point, you can't say that something does not work categorically. There are market wizards who trade off pure fundamentals or ones like Chris Camillo who trade off social arbitrage. You have day traders & scalpers who've made money we can't even imagine.
It might not work for you. Does not mean it does not work. There's a reason IBD has RS rankings, and why many O'Neil/Minervini followers require RS rankings of 80+
If your strategy works for you that's all that matters, I'm not here to say you're wrong or I'm right. As Jack Schwager put it, "There are 1000 ways to make money in the markets and the irony is they are all equally difficult to find" - my issue is you claiming your strat to be superior and another to be wrong when there is in fact a lot of evidence showing high RS names outperform.
Qullamaggie's strategy is by definition finding stocks that have shown immense RS and are now flagging, even if he doesn't call it that. I have dozens of examples like the one in the first image, this is a setup he traded.
The second image is AAPL on April 16, 2009. This is a direct example from the first O'Neil Disciples book where they explain pocket pivots. You can see that the stock had been outperforming the market for nearly 3 months leading to the buy point they specified, even while it was still consolidating.
Again my friend, whatever works for you works. I'm just here to point out you cannot say for a fact RS names do not continue to outperform. That is the definition of trend following and momentum trading.
This is a really fantastic study. I have a few questions I'd really appreciate if you could answer:
1 - What happens if you account for market, group & stock bias? I.e. if you only go long in an environment where the Nasdaq & S&P have positive sloping 20D MAs? If you only took the trades in biotech names when XBI has the same criteria, or ensure that the stock is in a prior uptrend. I believe that context like this could account for real-world trading decisions you'd have to take into account and lead to even better results in a backtest
2 - Is there any possible way to account for slippage or is that simply a limitation for studies of this kind?
3 - How are the returns affected if you winsorize? I understand this may be slightly redundant since for any trading strategy, the outlier returns are concentrated in a few trades, but 20+ >150R trades over a 7 year period seems unrealistic to me. (I am a swing trader, so maybe this is normal for daytrading and I'm not aware)
Thanks for posting the study and for the time.
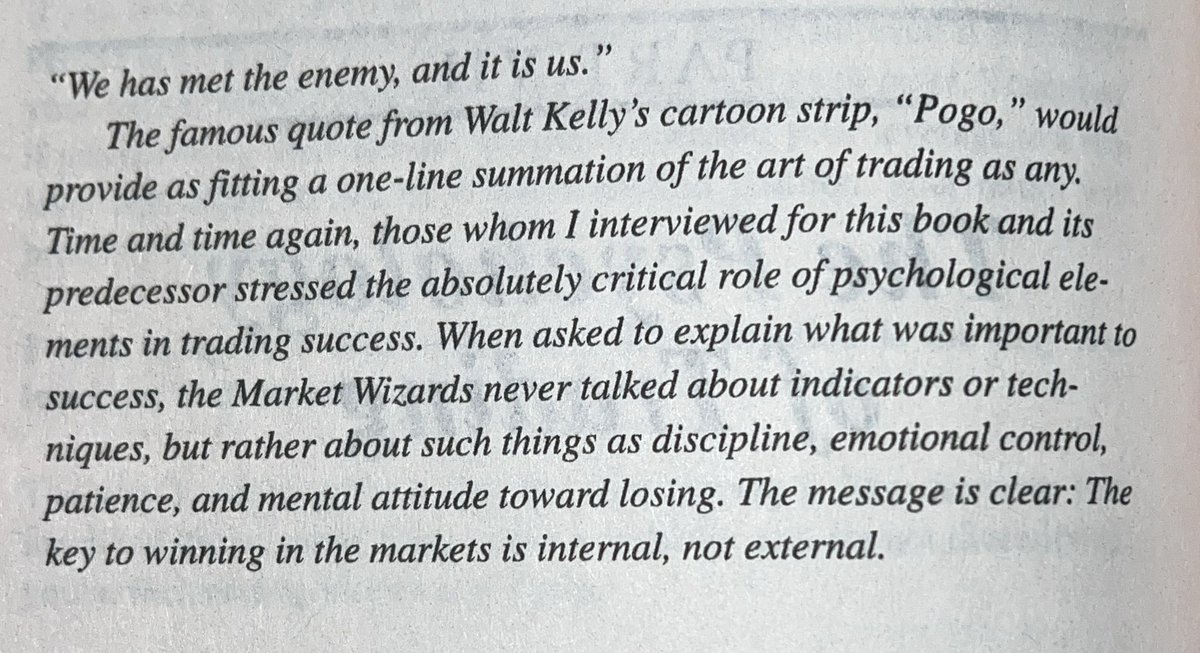
My goal is to be one of the top active investors alive. I’m completely delusional. Started from ground zero. Self taught. Thinking I can be the next qullamaggie. Or camillo. Next wizard.
If another man can use the markets to go from flat to $100M, then why not me? Dead serious.
With the insane run we've seen in $QQQ and $SOXX, it feels like a market that may need some digestion. I looked into an instance that popped up earlier this week, namely when all the MAs are stacked and the Nasdaq closes >2 ADRs above the 10D. Here's what happens historically ->
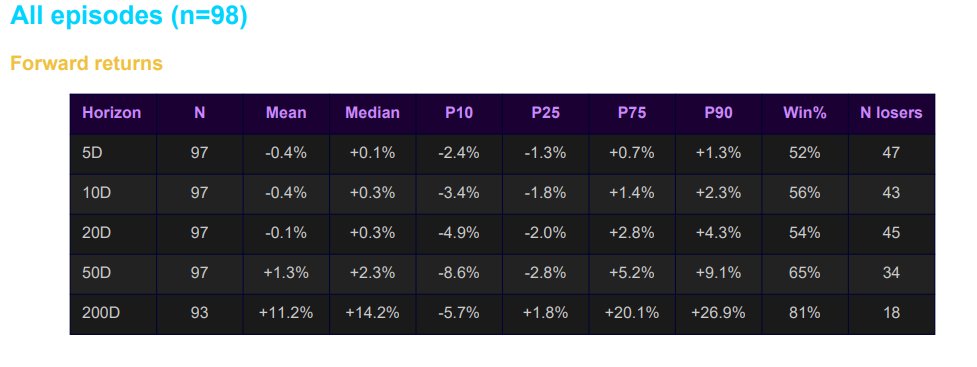
The full sample (n=98)
- Close > MA10 > MA20 > MA50 > MA 200 AND
- Close > 2ADR above MA10
The immediate picture is essentially nothing. Over the next 20D, and across the 5D & 10D timeframes the market moves very little in either direction.
The 50D is where it gets more interesting. Median return +2.3%, win rate 65%. Of the 34 losing episodes at 50 days, the median loss was -5.1% and the worst was -21.7% (January 2020, four weeks before COVID hit).
The 200D is the most compelling number in the study. Of 93 episodes with complete data, 75 were positive. Median return +14.2%, win rate 81%. Of the 18 losers, the vast majority trace directly to identifiable macro shocks (dot-com bust, GFC, COVID, the 2022 Fed rate shock) The setup itself has essentially never produced a meaningful 200D loss in a normal market environment.
When it happens at the all-time high (n=53)
53 of the 98 episodes occurred within 2% of the all-time high, including the current one. This is where the near-term picture deteriorates noticeably.
The 5D win rate drops and the median return goes negative. Profit taking and short-term chop are the base case in the first week. By 10 days you're back to a coin flip (52%), and by 20 days the win rate recovers to 54% with a median of +0.2%. The 50D median is +1.5% with a 63% win rate, lower than the full sample but still positive.
The 200D near-ATH picture is where the data gets most nuanced. Of 48 completed episodes near ATH, 38 were positive. Median return +15.9%, win rate 79%. The 10 losers all came from exogenous shocks. However the loser distribution is notably worse than the full sample: median loss -10.3%, worst -32.0%. When it goes wrong near ATH it goes more wrong, because those episodes are disproportionately the ones sitting at structural market peaks just before regime changes.
Based on 53 historical precedents in the same configuration, the base case for the next week is mild chop and profit taking. The base case for the next year, absent an exogenous macro shock, is a market that's 15% higher.
(Study done using Claude and yfinance data)