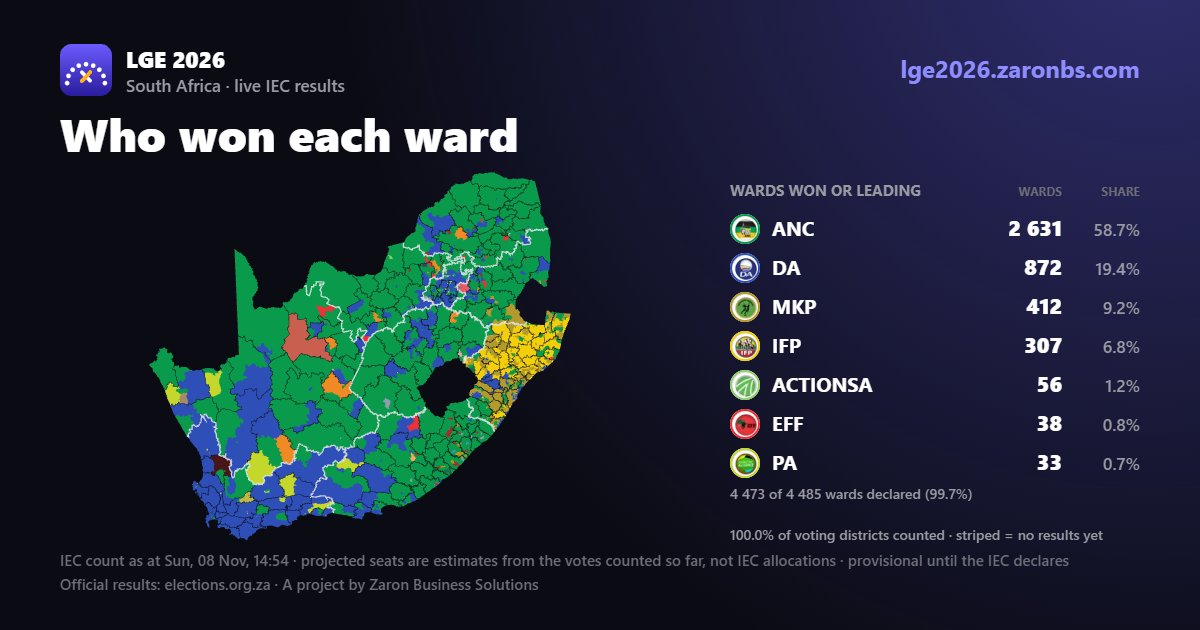
26 years of South Africa's local elections, ward by ward, in one map.
Every election since 2000 carried onto today's 4 485 wards. Press play and watch the country change.
https://t.co/2UQt7xbQvo
#LGE2026#LocalElections
2/2 Ok, so I have extracted from the timelapse (see previous tweet) the core indicators. They are in the slide below, and all based on the ward ballot.
This slide tells you a couple of important things.
Electoral competition has increased dramatically. In 2000, just 6.3% of VDs were won by margins of 10 percentage points or less. As of 2026, this has more than tripled to 19.6%.
Nearly three in ten VDs are now relatively competitive. In 2000, 9.4% of VDs were decided by margins of 15 points or less, compared with 28.4% in 2026.
The ANC is losing ground while its remaining victories become increasingly marginal. Between 2016 and 2026, the number of VDs won by the ANC fell from 17,133 to 12,927, while the proportion of its victories secured by 10 points or less increased from 5.1% to 15.4%. So, basically, its core support is being eroded.
The DA has expanded into increasingly competitive electoral territory. Between 2011 and 2026, its total VD victories increased by 32%, from 3,066 to 4,051. At the same time, the proportion of its victories secured by margins of 10 points or less increased from 8.0% to 14.6%. This is consistent with the DA expanding its electoral reach, by first winning marginal seats.
Other parties are becoming increasingly important. The ANC and DA collectively won 73% of closely contested VDs in 2000, but only 56% in 2026.
There are other nice comparative numbers in the timelapse, if you give them a close up.
If you had to boil this all down to one number, it is the average size of the winning margin across all VDs. It has gone:
2000: 62.00pts
2006: 65.79pts
2011: 64.21pts
2016: 55.23pts
2021: 46.20pts
2026: 33.27pts
At this rate, 2031 is going to be pretty spectacular.
I built this site because I wanted to be able to use something like this myself.
It simply collects Government Gazettes as published on the GPW website, and gives you a way to browse and search more conveniently.
https://t.co/EYOKhDjPCN
1/2 I am going to publish two related docs, to do with how competitive SA’s democracy is getting. The first is essentially visual, and if you are not interested in the details (which will follow in part 2 – separate tweet) simply check out the timelapse below. It tells you all you need to know in terms of the big picture: Red VDs = winning margin of 5pts or less, Dark to light orange – 5pt bands each until you get to 30pts. Blank VDs are “safe”. So, basically, the more red and dark orange, the more competitive the map is. Also, have a look at the pie chart, it shows how many VDs fall into every 5pt band up until a margin of 45pts. It, like the map, explodes as you work your way through to 2026. It tells you that the 2031 LGE is going to be even more competitive that 2026, so many marginal seats now. Give part 2 a read for all the ANC and DA details.
I've always believed a map changes the conversation.
A national total tells you who did well. A ward map shows your own street, and that's where councils must deliver for the next five years.
With most councils hung, a few still pending, local detail matters more.
#LGE2026
@NovusMediaZA The point about stability matters, because the budget, service contracts and repair backlogs carry on while the coalition is still being agreed.
@YOUFM898 Whichever parties end up together, residents will judge them on whether water, lights and refuse collection keep working while the deals are made.
Why did so many councils come out hung? Part of the answer goes back 26 years.
How many parties really count in our local vote: 2.4 in 2000, 3.7 in 2021, 5.7 in 2026.
As the vote spreads across more parties, fewer councils end up with one party in charge.
I started Zaron Business Solutions in 2013 as a geospatial and decision-intelligence firm. This week I've been following the local election results on the maps my team built.
I don't have a political take to add. I do hope the data helps officials, researchers, journalists and residents look at a particular place, not only the national number, before they decide what the election means.
LGE Trends: https://t.co/Tc6LKJsdTU
Coalition Lab: https://t.co/bfd4KkUdnJ
#LGE2026
Fact Check:
In an interview with @BizNewsCOM today, Athol Trollip said the following: “To take ANC wards, from the ANC, is not a weakness, it is a significant strength, because no political party, other than an ANC breakaway party – such as COPE or EFF or MKP - has ever been able to do that. Yes, the DA will tell you that grew by so much African support, but they can’t take a significant number of ANC wards.”
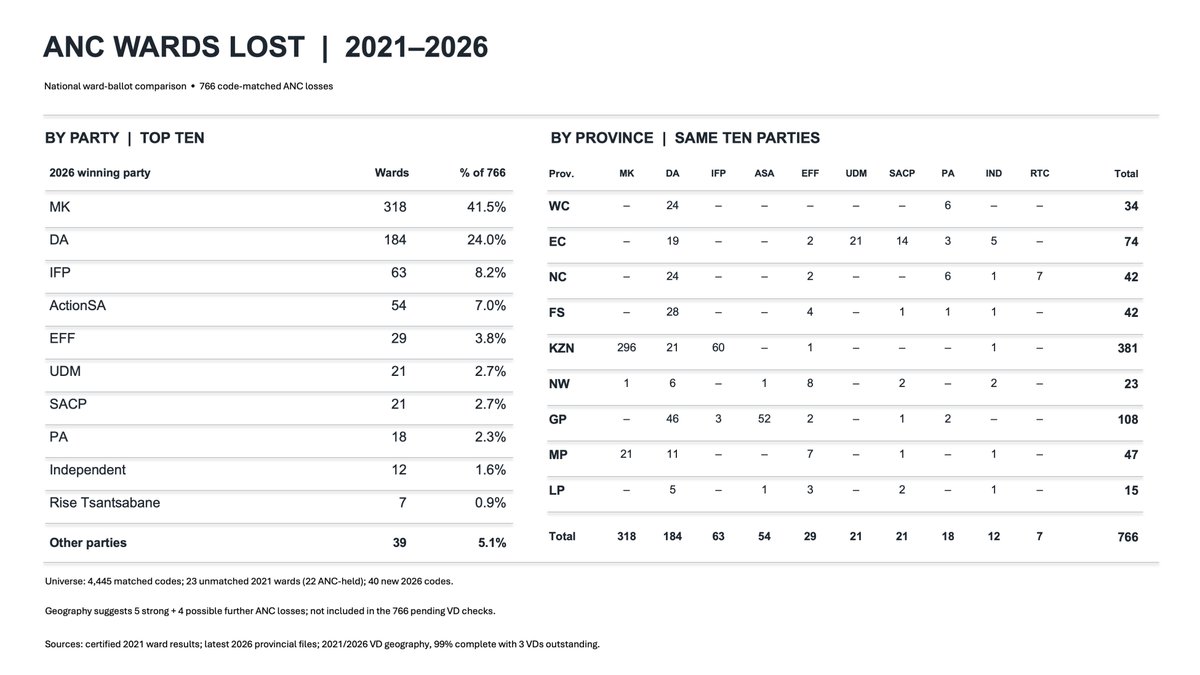
This is not just factually untrue, but also a gross distortion of what happened in 2026. Here is a slide of which party’s won the most wards off the ANC in 2026.
(The slide uses ward-ballot results, allowing for a direct comparison of 4,445 wards, covering 99.5% of the 2021 ward total. For the small number of wards whose codes had changed (23), their geographical boundaries were used to identify possible additional losses. The slide shows 766 confirmed ANC ward losses, broken down by the parties that gained them and by province. It also shows what percentage of all 766 losses each party accounted for. There might be some small error in these totals as the results are not verified, but they will be 99% accurate.)
MKP took the most ANC wards, 318 or 41.5% of all ANC ward losses; the DA took the second most off the ANC -184 wards off the ANC, or 24.0%. ASA, in fourth place behind the IFP, only took 54 wards off the ANC, or 7%.
Significantly, the DA also was the only party to take wards off the ANC in every single province. Even if one limits the universe to Gauteng alone, the DA took 46 wards off the ANC, and ASA 54, so more or less on par.
Corrections to results can happen after the official declaration, and sometimes seats can change.
I have created a page that shows these seat changes, with the first entry since Sunday being Ray Nkonyemi (KZN216), where the DA gained a seat.
https://t.co/iV8NyumKXj
Turnout went up this time: 51.8% in the councils counted, compared with 46.4% in the same councils in 2021.
Mkhambathini saw the biggest jump, up 21.1 points.
What do you think got more people out to vote in your area?
Most councils came out hung, with a few still pending, so the next few weeks are about who becomes mayor, speaker and whip.
For most residents the real test is simpler: water, lights and refuse.
What would you want your new council to fix first?