It’s been 14 days since I posted my @HyperliquidX DEXs dashboard on @GlintAnalytics, and I decided to check back on it today to see how Hyperliquid rounded off the year.
> Total DEX trades rounded up to 34M trades, that’s roughly 2M trades in the last 14 days.
> Total DEX volume exceeded $34B, over $1B in volume in the past 14 days.
> Distinct addresses also grew by over 3.5K, which shows new users are being onboarded to Hyperliquid on a daily basis.
However, the average trade size did drop a bit. As of the last time the dashboard was refreshed, it was at $1.07k, and now it’s currently at $1.05k.
I also noticed a decline in monthly volume. Off the top of my head, I can attribute this to two things.
Case one: most folks were celebrating Christmas, New Year and spending some time off-screen, hence the lower volume in December.
Case two: with all the buzz around perp DEXs and potential rewards, traders are moving to other DEXs they believe could offer future rewards, similar to how Hyperliquid airdropped its users.
Case two is most likely the better explanation.
I did spot a few other changes, but nothing out of the ordinary yet. Overall, I’d say Hyperliquid had a strong year in terms of DEX trading in 2025. Let’s see what 2026 holds for Hyperliquid.
The @HyperliquidX data went live on the @GlintAnalytics platform 25 days ago. With all the buzz around Hyperliquid soaring without being listed on any centralized exchanges, I couldn’t help but wonder what kind of traction Hyperliquid-based DEXs were actually getting on-chain.
After checking the available datasets, I came across the DEX trades table. I dived in and was able to uncover what’s been happening on-chain, and as expected, these DEXs have been moving some serious volume.
Before getting into my findings, a few things to note:
- The available data runs from February 2025 till present day
- Only three DEXs are currently accounted for on Glint: @HyperSwap, @HybraFinance, and @prjx_hl
- Trades executed by the system address
0x22222222222222222222222222222222222222 were excluded from the analysis
Now, let’s dive in:
𝐊𝐞𝐲 𝐊𝐏𝐈𝐬
𝗧𝗼𝘁𝗮𝗹 𝗧𝗿𝗮𝗱𝗲𝘀
From February till date, a total of 32.88 million trades have been executed across these three DEXs. That’s an impressive level of activity if you ask me.
𝗧𝗼𝘁𝗮𝗹 𝗩𝗼𝗹𝘂𝗺𝗲
Across these three DEXs, a massive $33.4B in trading volume has been generated so far. It’s interesting to imagine where this number could be by year-end.
𝗗𝗶𝘀𝘁𝗶𝗻𝗰𝘁 𝗔𝗱𝗱𝗿𝗲𝘀𝘀𝗲𝘀
So far, 233.42k unique addresses have interacted with these DEXs at least once.
𝗔𝘃𝗲𝗿𝗮𝗴𝗲 𝗧𝗿𝗮𝗱𝗲 𝗦𝗶𝘇𝗲
On average, each trade has a volume of $1,070. This suggests a healthy mix of retail and mid-sized traders.
𝐌𝐚𝐫𝐤𝐞𝐭 & 𝐏𝐫𝐨𝐭𝐨𝐜𝐨𝐥 𝐈𝐧𝐬𝐢𝐠𝐡𝐭𝐬
Looking at the top 10 traded token pairs, USDT0/WHYPE leads the pack with over $15B in volume, clearly acting as the primary liquidity pair in the ecosystem.
I also analyzed transaction count and volume by project, and one thing became immediately clear:
“𝙃𝙞𝙜𝙝 𝙩𝙧𝙖𝙣𝙨𝙖𝙘𝙩𝙞𝙤𝙣 𝙘𝙤𝙪𝙣𝙩 𝙙𝙤𝙚𝙨 𝙣𝙤𝙩 𝙖𝙡𝙬𝙖𝙮𝙨 𝙩𝙧𝙖𝙣𝙨𝙡𝙖𝙩𝙚 𝙩𝙤 𝙝𝙞𝙜𝙝 𝙫𝙤𝙡𝙪𝙢𝙚”
In this case;
- Hyperswap leads in transaction count with 15M trades
- PRJX follows closely with 13M trades.
However, when volume is considered:
PRJX dominates with over $20B in volume, while Hyperswap follows with roughly $10B
This suggests different user behavior and trade size dynamics across protocols.
𝗩𝗼𝗹𝘂𝗺𝗲 𝗚𝗿𝗼𝘄𝘁𝗵 𝗢𝘃𝗲𝗿 𝗧𝗶𝗺𝗲
When looking at monthly volume trends, trading activity has been steadily increasing since February 2025.
The most notable jump occurred between June and August, where monthly volume surged from just over $1B to above $6B. This clearly shows that interaction with Hyperliquid DEXs is accelerating as time goes on.
𝗧𝗿𝗮𝗱𝗲 𝗦𝗶𝘇𝗲/𝗩𝗼𝗹𝘂𝗺𝗲 𝗗𝗶𝘀𝘁𝗿𝗶𝗯𝘂𝘁𝗶𝗼𝗻
A large portion of transactions fall below $1k, indicating strong retail participation.
However, when volume is analyzed, trades in the $1k–$10k range dominate, generating over $18B in total volume.
𝗔𝗱𝗱𝗿𝗲𝘀𝘀 𝗔𝗰𝘁𝗶𝘃𝗶𝘁𝘆 𝗗𝗶𝘀𝘁𝗿𝗶𝗯𝘂𝘁𝗶𝗼𝗻
Most users fall into the 1–10 trades bucket, while only a small fraction of addresses have executed 500+ trades.
𝗧𝗼𝗽 𝗔𝗱𝗱𝗿𝗲𝘀𝘀𝗲𝘀 𝗯𝘆 𝗩𝗼𝗹𝘂𝗺𝗲
Finally, I looked into the top 10 addresses by volume. After identifying and excluding an outlier, the results showed that the top two addresses alone have processed roughly $2B in volume, an impressive figure that highlights the presence of high-value traders or advanced market participants on the network.
Overall, the data paints a clear picture of a rapidly growing and increasingly active Hyperliquid ecosystem.
Despite being live for a relatively short period and the $HYPE token operating without major centralized exchange listings, Hyperliquid-based DEXs are already processing tens of millions of trades, tens of billions in volume, and hundreds of thousands of unique users.
PS: To view the most recent data, refresh the visuals.
To view the analytics dashboard, click here👇🏽
https://t.co/TKOF2rBpv7
Been waiting for something like this 👀
Creating content about Solana anyway might as well get rewarded for it.
How to join 📚
* go to https://t.co/YOcrPFgM57
* sign up using twitter
* Participate in campaigns
Thats all for now
LFG 🔥
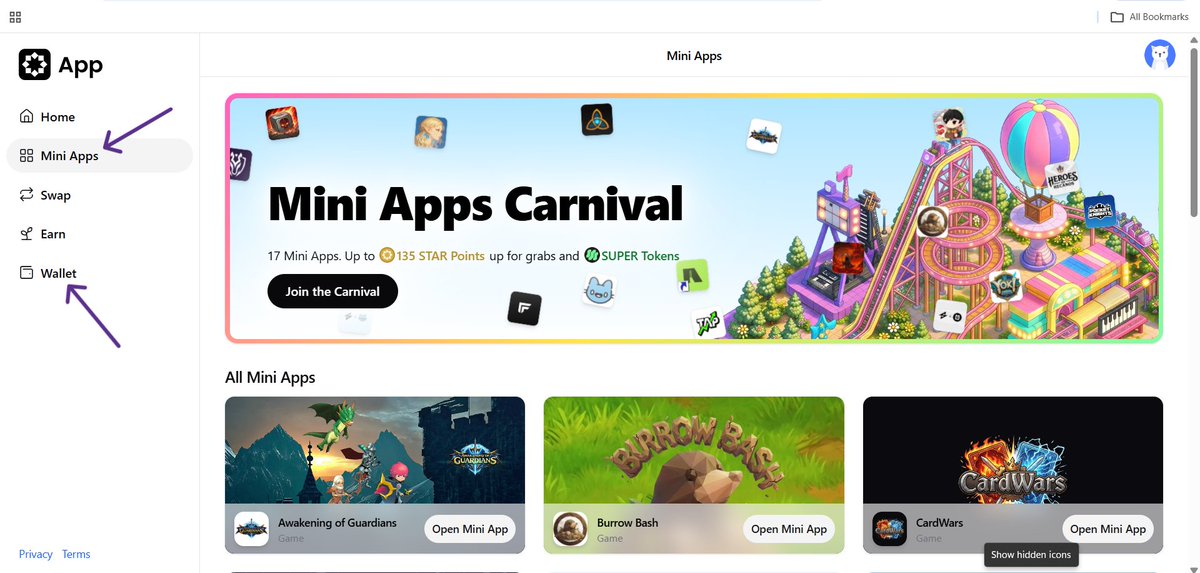
Base app competition is coming.
I have found an app that is going to compete @base app
the project raised 70 Million USD yes, you heard it right.
also, fully backed by Sony.
the app is being built for Soneium if you remember this project.
App name is Startale
It is a crypto super app built for the Startale Group and Sony Block Solutions Labs ecosystem called @soneium
The app tries to make crypto feel easy like a normal mobile app.
Instead of using,
> many wallets
> many websites
> many transactions
everything is inside one app. Tough competition is coming for $BASE in my opinion.
follow these steps to join,
1. Open https://t.co/aESgy7UiTs
2. signup with your email or wallet
3. I used email to signup
4. it will create your in app wallet.
5. explore all mini apps and earn Star points.
6. more activity = more points = more expected airdrop
7. the app will become a complete launchpad for new projects and airdrops in future (they claim)
8. Deposit USDC or ETH in your wallet will give you boost in star points.
Goodluck.
Most people still associate leveraged trading with centralized exchanges.
But looking at @GMX_IO, it’s clear that a meaningful amount of that activity has already moved onchain.
I tried to understand what this shift actually looks like from a data perspective, not just volume, but markets and where risk builds up.
So I analyzed market-specific activity across GMX in respect to the @arbitrum blockchain.
A few things stood out.
First, the idea that the market has constantly been flipping between bullish and bearish phases over the years doesn’t fully show up here.
Across time, long positions consistently outnumber shorts, suggesting that traders have a bullish bias more often than not, but only on selected assets.
That selectivity became clearer when I looked at market concentration.
$ETH, $BTC, and $SOL dominate both volume and trade activity.
$ETH alone accounts for over $225B in traded volume, with $BTC following at ~$162B and $SOL far behind.
I got to understand that while participation exists across many markets, capital is heavily concentrated in just a few markets.
On the risk side, the picture changes.
Trading isn’t all roses as we all know, over time the total USD lost to liquidation exceeds $800M with $WETH liquidation accounting for over 50% of that with over $450M in liquidations.
To fully understand the data and details, feel free to take a look at the market intelligence dashboard and report in the comments.
Most people still associate leveraged trading with centralized exchanges.
But looking at @GMX_IO, it’s clear that a meaningful amount of that activity has already moved onchain.
I tried to understand what this shift actually looks like from a data perspective, not just volume, but markets and where risk builds up.
So I analyzed market-specific activity across GMX in respect to the @arbitrum blockchain.
A few things stood out.
First, the idea that the market has constantly been flipping between bullish and bearish phases over the years doesn’t fully show up here.
Across time, long positions consistently outnumber shorts, suggesting that traders have a bullish bias more often than not, but only on selected assets.
That selectivity became clearer when I looked at market concentration.
$ETH, $BTC, and $SOL dominate both volume and trade activity.
$ETH alone accounts for over $225B in traded volume, with $BTC following at ~$162B and $SOL far behind.
I got to understand that while participation exists across many markets, capital is heavily concentrated in just a few markets.
On the risk side, the picture changes.
Trading isn’t all roses as we all know, over time the total USD lost to liquidation exceeds $800M with $WETH liquidation accounting for over 50% of that with over $450M in liquidations.
To fully understand the data and details, feel free to take a look at the market intelligence dashboard and report in the comments.