Microsoft just released a tool that lets you convert Office files to Markdown. Never thought I'd see the day.
Google also added Markdown export to Google Docs a few months ago.
Looking to create clean, publication-ready correlation matrices with minimal effort? The ggcorrmat() function from the ggstatsplot package makes it easy to generate correlalograms, displaying relationships between variables at a glance.
✔️ Effortless Correlation Visualization: Produces a matrix of correlation coefficients with just a few lines of code, giving you instant insights into variable relationships.
✔️ Publication-Ready by Default: Even with default settings, ggcorrmat() generates polished, professional plots suitable for presentations and reports.
✔️ Customizable Appearance: Modify various aesthetic options to adjust colors, labels, and layout, ensuring the correlation matrix matches your style and needs.
✔️ Seamless Integration: Works directly with ggplot2, allowing you to enhance and fine-tune your plots with the same syntax you already know.
The visualization shown here is from the package website, illustrating how ggcorrmat() makes it simple to analyze and present correlations effectively: https://t.co/kQ1KUseS6u
Want to unlock the full potential of ggplot2 and its versatile extensions for creating stunning visualizations? Sign up for my online course, “Data Visualization in R Using ggplot2 & Friends!”
See this link for additional information: https://t.co/ztlEzoEDWv
#Statistics #ggplot2 #Rpackage #statisticsclass #DataVisualization #tidyverse
The fastest way to learn Shiny is
1️⃣ Skim the getting started section of Mastering Shiny https://t.co/8NNgXAGqa7
2️⃣ Start with your own Shiny app
3️⃣ Google everything as you go
4️⃣ Teach someone what you've learned
(Last step is optional but it's a 10x step)
#rstats
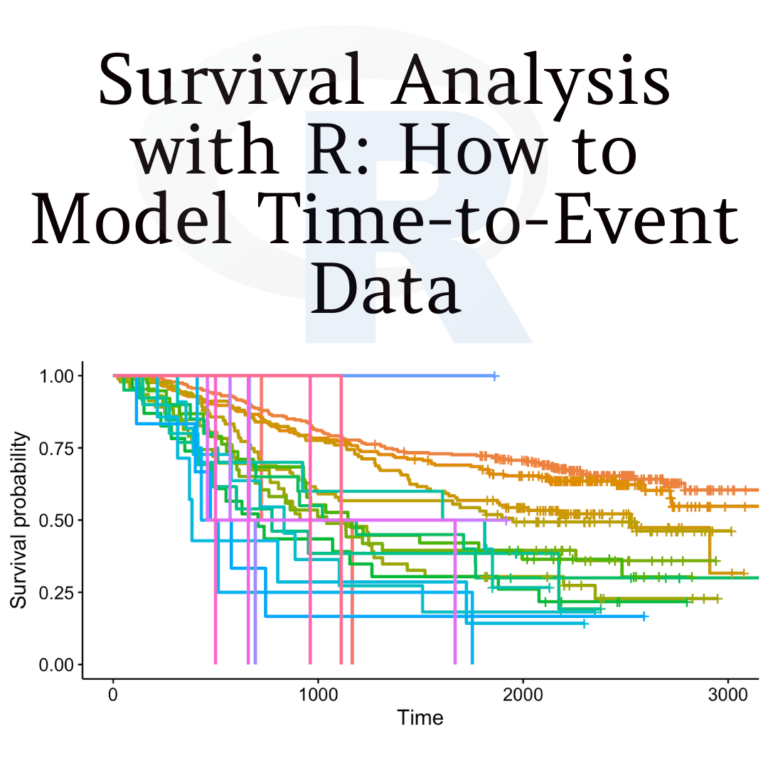
Survival analysis is a statistical technique used to analyze time-to-event data, such as the time until death or the time until the failure of a machine. https://t.co/wJVH2Vvi2H
#DataScience#RStats#DataAnalytics#programming#dataviz
https://t.co/2ieTZZgzo3
The tidyverse style guide, by hadleywickham - https://t.co/iZR8PEbod0
Both provide excellent guidelines for #Rstats code collaboration. Enjoy!
https://t.co/tB3rzMg7dN (2/2)
Our online mixOmics workshop starts in 3 weeks! It is self paced with 4 live webinars. Opportunity to analyse your own data. Register here 👇
https://t.co/fYixFQdDIf
Multivariate dimension reduction, omics data exploration & integration
#omics#bioinformatics#rstats
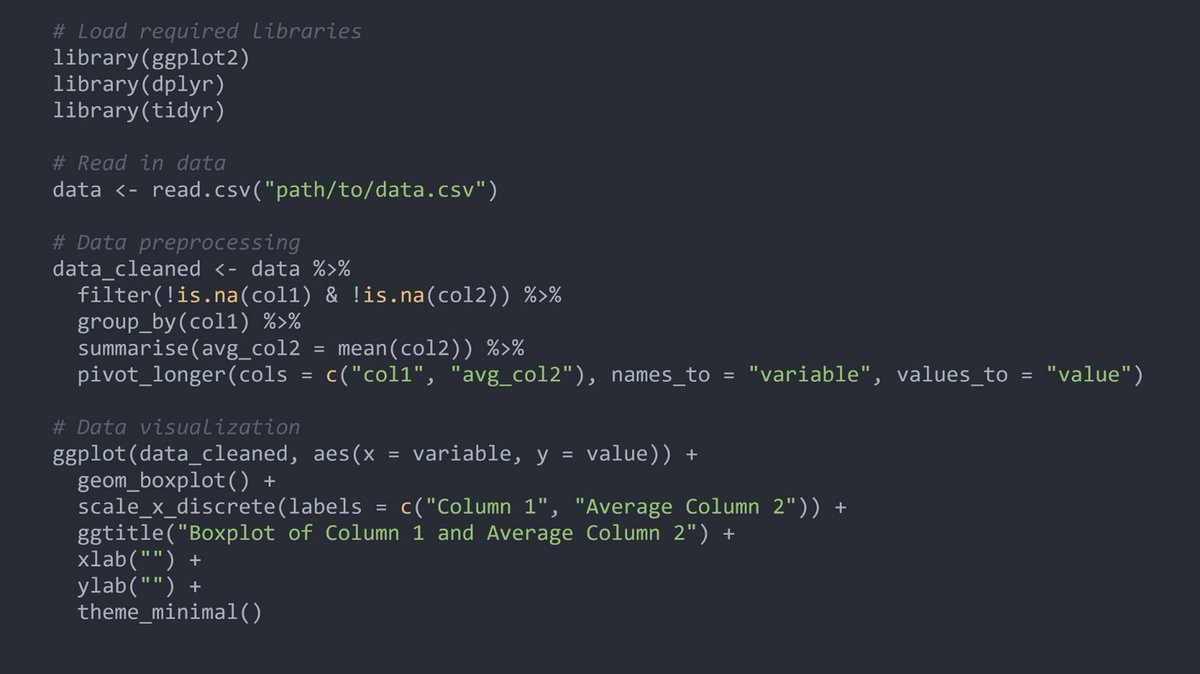
1.Loads libraries: ggplot2, dplyr, and tidyr.
2.Reads in a CSV file.
3.Cleans the data by removing rows with missing values in col1 or col2.
Visualizes the cleaned data.
#rstats#datascience#dataviz#machinelearning#dataanalysis
R is a popular programming language used in data analysis and statistical computing. If you're interested in learning R but don't want to spend money on courses, there are plenty of free resources available online 👇
#rstats#DataScience