Replica was fortunate to partner with this research team to provide the data used to study the estimated racial composition of roads. Incredible work @iamwfx @trnsprtst @heyitsmikesmart @nebiyoutilman
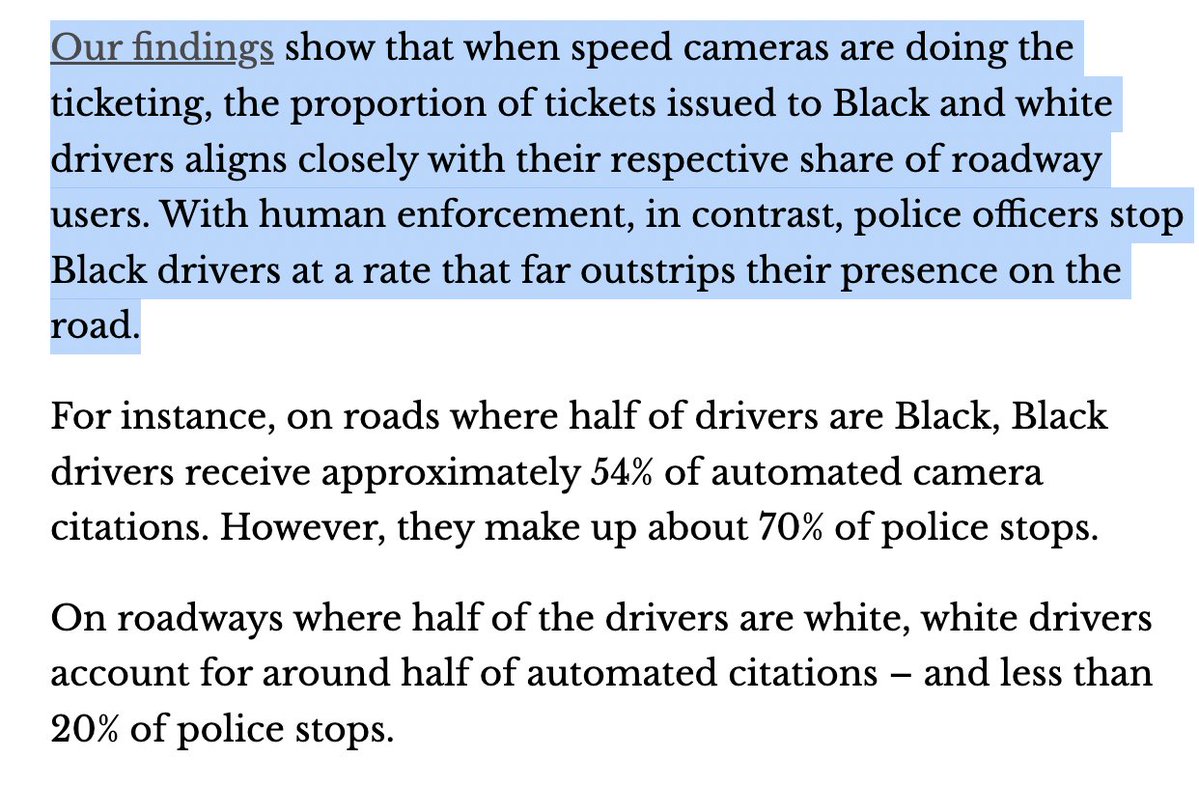
Hard to overstate how much of an improvement speed cameras are compared to police issuing tickets.
Speed cameras are *way* more fair -- and also more reliable.
https://t.co/HeSuvnyik9
We're excited to announce that our newest app, the OD Flows Explorer is now live in platform. It's now easier than ever to map and analyze ODs for custom geographies, specific modes, and certain times of day.
https://t.co/W7Poocr80D
What do we hear most from DOT customers who use our Road Closure Scenario Tool? Speed matters. Rather than waiting weeks to run just one scenario, customers can run 5+ at once and get results back the same week. We ran this scenario in LA in just 24 hrs:
https://t.co/LekU19nhhs
check out this @BuildingsCities article from authors at @RockyMtnInst, @BerkeleyLab , & @TernerHousing. The research team leveraged Replica data to study national VMT & explore the potential for state urban land-use reforms to enable energy sufficiency https://t.co/i3K2SbIV7Y
Replica builds applications & analytics to support Transportation Systems Management & Operations (TSMO) strategies nationwide. We’re making it easier for agencies to manage performance from a systems perspective & consider the entire project lifecycle.
https://t.co/WCRshLeyY7
With Fall 2023 data released & Spring 2024 data coming next month, customers have access to detailed data for all modes – transit, TNC, walking, & biking + vehicular & freight traffic – that includes network volumes, trip purpose, & traveler demographics. https://t.co/l8iKFJjEGm
🧵 With Labor Day behind us and temperatures dropping (except maybe in Phoenix, which just hit its 100th straight day of 100 degree days), we know agencies are diving into a busy Fall.
As this work ramps up, we wanted to give a quick summary of what we launched over the Summer
The Safe Safe Streets Planner combines driving event data and multi-modal data to identify high-risk corridors and make it easier than ever to generate safety action plans. We’ve also added the ability for customers to add crash data to the app. https://t.co/k8jVbvmpnk
With the now-live Active Transportation Planner App, you can upload or draw your own bike and ped infrastructure to get likely mode shift from vehicular to active modes. Plus we’re giving two organizations a free Active Transportation Planner Analysis https://t.co/COTwRs7UXO
The options available in the Gate OD App grow. Now use zones as well as links for entry, middle, and exit gates, making it even easier to generate OD tables, matrices, and maps with geos you already use in your org, such as custom traffic analysis zones. https://t.co/SmaAL9rRLv
Agencies are now using Replica’s Road Closure Scenario App to forecast the impact of road closures quickly. From temporary lane closures for construction to permanent closures for pedestrian safety, the app makes it quicker for agencies to run scenarios. https://t.co/VdMB7uQxJw
How does it affect locals? this minimal detour for the drivers on Wilshire (avg. income $102K) creates a safer, more welcoming environment for the residents, walkers, and bikers in the local Westlake neighborhood (avg. income $53,000).
We used our new Road Closure Scenario App to forecast the impact of the City of Los Angeles's proposal to prohibit cars on Wilshire Boulevard through MacArthur Park and prioritize pedestrians and park goers. https://t.co/LekU19mJrU
The bottom line? The changes add little to no congestion to the network, while trips that previously used that portion of Wilshire increase on average by less than a single mile.
We used our new Road Closure Scenario App to forecast the impact of the City of Los Angeles's proposal to prohibit cars on Wilshire Boulevard through MacArthur Park and prioritize pedestrians and park goers. https://t.co/LekU19mJrU
We used our new Road Closure Scenario App to forecast the impact of the City of Los Angeles's proposal to prohibit cars on Wilshire Boulevard through MacArthur Park and prioritize pedestrians and park goers. https://t.co/LekU19mJrU
We teamed up with @felt to dive into the controversial congestion pricing plan in NYC. With Replica, it’s possible to analyze commute patterns by location, industry, household income, race/ethnicity, mode of transportation, & when people go to work. https://t.co/1JcEiVvshB
1/ 🚦We recently teamed up with @replica, a transportation data and solutions firm, to explore the impacts of NYC's controversial congestion pricing proposal. @STurell, Replica’s Chief of Staff, shares a fascinating visual analysis using Felt, including:
As the Congestion Pricing conversation continues, Replica data gives key insights into who is most impacted. Take a look at how @StreetsblogNYC leveraged Replica to make their case: https://t.co/uUsNxpU9o2
@StreetsblogNYC used Replica to make a data-driven case for why a protected Bike Lane on Bedford Ave in Brooklyn NY would benefit local residents and businesses. Check out their assessment: https://t.co/Bou46l3gKA
On what would have been the first Monday of New York City's Congestion Pricing Plan, a team from The New York Times spent the morning counting cars to estimate potential revenue. They relied on Replica to fill in gaps and get a wider picture of activity: https://t.co/d4quZHdolG